Python绘制圆形、扇形和多边形图
此示例演示了如何使用collections.PatchCollection。
另请参阅 Matplotlib 艺术家的参考资料,它会将每个艺术家分别添加到其自己的坐标轴中。
import matplotlib.pyplot as plt
import numpy as np
from matplotlib.collections import PatchCollection
from matplotlib.patches import Circle, Polygon, Wedge
# 固定随机状态以实现可重复性
np.random.seed(19680801)
fig, ax = plt.subplots()
resolution = 50 # the number of vertices
N = 3
x = np.random.rand(N)
y = np.random.rand(N)
radii = 0.1*np.random.rand(N)
patches = []
for x1, y1, r in zip(x, y, radii):
circle = Circle((x1, y1), r)
patches.append(circle)
x = np.random.rand(N)
y = np.random.rand(N)
radii = 0.1*np.random.rand(N)
theta1 = 360.0*np.random.rand(N)
theta2 = 360.0*np.random.rand(N)
for x1, y1, r, t1, t2 in zip(x, y, radii, theta1, theta2):
wedge = Wedge((x1, y1), r, t1, t2)
patches.append(wedge)
#关于楔形的一些限制条件
patches += [
Wedge((.3, .7), .1, 0, 360), # Full circle
Wedge((.7, .8), .2, 0, 360, width=0.05), # Full ring
Wedge((.8, .3), .2, 0, 45), # Full sector
Wedge((.8, .3), .2, 45, 90, width=0.10), # Ring sector
]
for i in range(N):
polygon = Polygon(np.random.rand(N, 2), closed=True)
patches.append(polygon)
colors = 100 * np.random.rand(len(patches))
p = PatchCollection(patches, alpha=0.4)
p.set_array(colors)
ax.add_collection(p)
fig.colorbar(p, ax=ax)
plt.show()
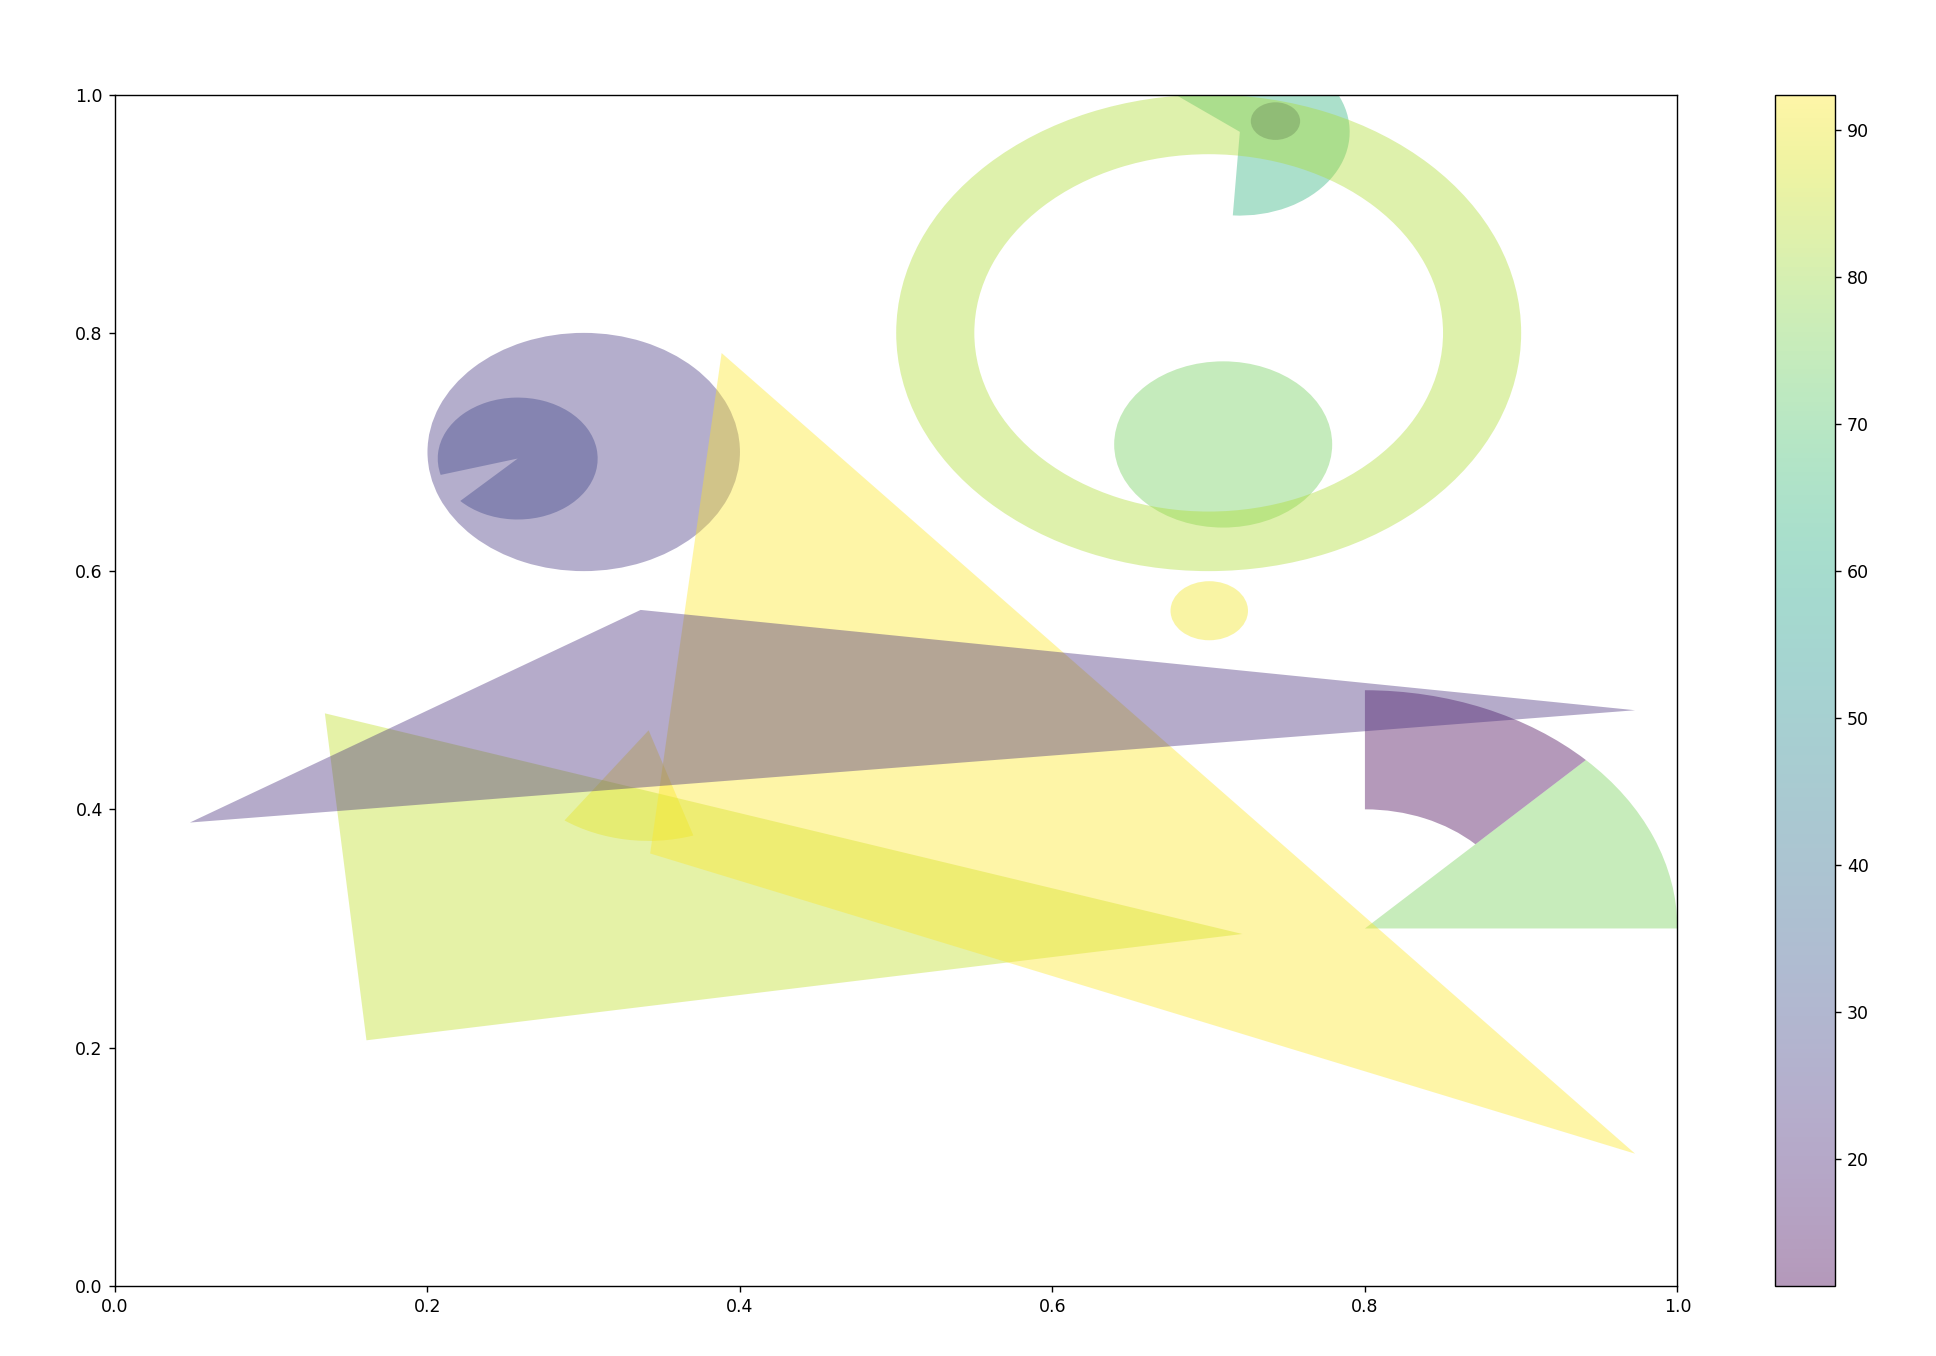
参考文献:https://matplotlib.org/stable/gallery/shapes_and_collections/patch_collection.html

这里是“一人公司”的成长家园。我们提供从产品曝光、技术变现到法律财税的全栈内容,并连接云服务、办公空间等稀缺资源,助你专注创造,无忧运营。
更多推荐



 5
5 0
0- 0



 已为社区贡献2条内容

所有评论(0)