Gemini与GPT联动(保姆级顶会绘图教程)
1.简介
本教程采用一套标准化的工作流,将复杂的绘图任务拆解为 “逻辑构建(The Architect)” 与 “视觉渲染(The Renderer)” 两个独立且互补的环节。通过利用 LLM 强大的逻辑推理能力来指导绘图模型的像素生成能力,我们能够产出符合 CVPR/NeurIPS 等顶刊标准的学术插图!
2.逻辑构建(The Architect)
目标:利用逻辑推理能力强的 LLM(如 Gemini 3 Pro, GPT-5, Claude 4.5)将你的论文内容转化为一份[VISUAL SCHEMA]。
操作指南:请复制下方的 Prompt,并将你的论文摘要或方法章节的内容附在最后。这一步的核心在于将抽象的算法逻辑转化为绘图模型能够理解的“强硬”物理描述。
# Role
你是一位 CVPR/NeurIPS 顶刊的**视觉架构师**。你的核心能力是将抽象的论文逻辑转化为**具体的、结构化的、几何级的视觉指令**。

# Objective
阅读我提供的论文内容,输出一份 **[VISUAL SCHEMA]**。这份 Schema 将被直接发送给 AI 绘图模型,因此必须使用**强硬的物理描述**。

# Phase 1: Layout Strategy Selector (关键步骤:布局决策)
在生成 Schema 之前,请先分析论文逻辑,从以下**布局原型**中选择最合适的一个(或组合):
1.  **Linear Pipeline**: 左→右流向 (适合 Data Processing, Encoding-Decoding)。
2.  **Cyclic/Iterative**: 中心包含循环箭头 (适合 Optimization, RL, Feedback Loops)。
3.  **Hierarchical Stack**: 上→下或下→上堆叠 (适合 Multiscale features, Tree structures)。
4.  **Parallel/Dual-Stream**: 上下平行的双流结构 (适合 Multi-modal fusion, Contrastive Learning)。
5.  **Central Hub**: 一个核心模块连接四周组件 (适合 Agent-Environment, Knowledge Graphs)。

# Phase 2: Schema Generation Rules
1.  **Dynamic Zoning**: 根据选择的布局,定义 2-5 个物理区域 (Zones)。不要局限于 3 个。
2.  **Internal Visualization**: 必须定义每个区域内部的“物体” (Icons, Grids, Trees),禁止使用抽象概念。
3.  **Explicit Connections**: 如果是循环过程,必须明确描述 "Curved arrow looping back from Zone X to Zone Y"。

# Output Format (The Golden Schema)
请严格遵守以下 Markdown 结构输出:

---BEGIN PROMPT---

[Style & Meta-Instructions]
High-fidelity scientific schematic, technical vector illustration, clean white background, distinct boundaries, academic textbook style. High resolution 4k, strictly 2D flat design with subtle isometric elements.

[LAYOUT CONFIGURATION]
* **Selected Layout**: [例如:Cyclic Iterative Process with 3 Nodes]
* **Composition Logic**: [例如:A central triangular feedback loop surrounded by input/output panels]
* **Color Palette**: Professional Pastel (Azure Blue, Slate Grey, Coral Orange, Mint Green).

[ZONE 1: LOCATION - LABEL]
* **Container**: [形状描述, e.g., Top-Left Panel]
* **Visual Structure**: [具体描述, e.g., A stack of documents]
* **Key Text Labels**: "[Text 1]"

[ZONE 2: LOCATION - LABEL]
* **Container**: [形状描述, e.g., Central Circular Engine]
* **Visual Structure**: [具体描述, e.g., A clockwise loop connecting 3 internal modules: A (Gear), B (Graph), C (Filter)]
* **Key Text Labels**: "[Text 2]", "[Text 3]"

[ZONE 3: LOCATION - LABEL]
... (Add Zone 4/5 if necessary based on layout)

[CONNECTIONS]
1.  [描述连接线, e.g., A curved dotted arrow looping from Zone 2 back to Zone 1 labeled "Feedback"]
2.  [描述连接线, e.g., A wide flow arrow from Zone 2 to Zone 3]

---END PROMPT---
3.绘图渲染(The Renderer)
目标:利用 Nano-Banana Pro 的指令遵循能力,将蓝图转化为像素。
操作指南:请复制下面的通用模板。注意,你只需要将步骤一生成的 ---BEGIN PROMPT--- 到 ---END PROMPT--- 之间的内容(包含方括号内的英文)完整粘贴进去即可,无需做任何修改。
**Style Reference & Execution Instructions:**

1.  **Art Style (Visio/Illustrator Aesthetic):**
    Generate a **professional academic architecture diagram** suitable for a top-tier computer science paper (CVPR/NeurIPS).
    * **Visuals:** Flat vector graphics, distinct geometric shapes, clean thin outlines, and soft pastel fills (Azure Blue, Slate Grey, Coral Orange).
    * **Layout:** Strictly follow the spatial arrangement defined below.
    * **Vibe:** Technical, precise, clean white background. NOT hand-drawn, NOT photorealistic, NOT 3D render, NO shadows/shading.

2.  **CRITICAL TEXT CONSTRAINTS (Read Carefully):**
    * **DO NOT render meta-labels:** Do not write words like "ZONE 1", "LAYOUT CONFIGURATION", "Input", "Output", or "Container" inside the image. These are structural instructions for YOU, not text for the image.
    * **ONLY render "Key Text Labels":** Only text inside double quotes (e.g., "[Text]") listed under "Key Text Labels" should appear in the diagram.
    * **Font:** Use a clean, bold Sans-Serif font (like Roboto or Helvetica) for all labels.

3.  **Visual Schema Execution:**
    Translate the following structural blueprint into the final image:

[在此处直接粘贴 Step 1 生成的 ---BEGIN PROMPT--- ... ---END PROMPT--- 内容(包含方括号内的英文)]
4.实战演示
4.1生成Prompt
打开GPT或者其它AI模型,上传手稿或者输入绘图要求(摘要),并输入指令:
# Role
你是一位 CVPR/NeurIPS 顶刊的**视觉架构师**。你的核心能力是将抽象的论文逻辑转化为**具体的、结构化的、几何级的视觉指令**。

# Objective
阅读我提供的论文内容,输出一份 **[VISUAL SCHEMA]**。这份 Schema 将被直接发送给 AI 绘图模型,因此必须使用**强硬的物理描述**。

# Phase 1: Layout Strategy Selector (关键步骤:布局决策)
在生成 Schema 之前,请先分析论文逻辑,从以下**布局原型**中选择最合适的一个(或组合):
1.  **Linear Pipeline**: 左→右流向 (适合 Data Processing, Encoding-Decoding)。
2.  **Cyclic/Iterative**: 中心包含循环箭头 (适合 Optimization, RL, Feedback Loops)。
3.  **Hierarchical Stack**: 上→下或下→上堆叠 (适合 Multiscale features, Tree structures)。
4.  **Parallel/Dual-Stream**: 上下平行的双流结构 (适合 Multi-modal fusion, Contrastive Learning)。
5.  **Central Hub**: 一个核心模块连接四周组件 (适合 Agent-Environment, Knowledge Graphs)。

# Phase 2: Schema Generation Rules
1.  **Dynamic Zoning**: 根据选择的布局,定义 2-5 个物理区域 (Zones)。不要局限于 3 个。
2.  **Internal Visualization**: 必须定义每个区域内部的“物体” (Icons, Grids, Trees),禁止使用抽象概念。
3.  **Explicit Connections**: 如果是循环过程,必须明确描述 "Curved arrow looping back from Zone X to Zone Y"。

# Output Format (The Golden Schema)
请严格遵守以下 Markdown 结构输出:

---BEGIN PROMPT---

[Style & Meta-Instructions]
High-fidelity scientific schematic, technical vector illustration, clean white background, distinct boundaries, academic textbook style. High resolution 4k, strictly 2D flat design with subtle isometric elements.

[LAYOUT CONFIGURATION]
* **Selected Layout**: [例如:Cyclic Iterative Process with 3 Nodes]
* **Composition Logic**: [例如:A central triangular feedback loop surrounded by input/output panels]
* **Color Palette**: Professional Pastel (Azure Blue, Slate Grey, Coral Orange, Mint Green).

[ZONE 1: LOCATION - LABEL]
* **Container**: [形状描述, e.g., Top-Left Panel]
* **Visual Structure**: [具体描述, e.g., A stack of documents]
* **Key Text Labels**: "[Text 1]"

[ZONE 2: LOCATION - LABEL]
* **Container**: [形状描述, e.g., Central Circular Engine]
* **Visual Structure**: [具体描述, e.g., A clockwise loop connecting 3 internal modules: A (Gear), B (Graph), C (Filter)]
* **Key Text Labels**: "[Text 2]", "[Text 3]"

[ZONE 3: LOCATION - LABEL]
... (Add Zone 4/5 if necessary based on layout)

[CONNECTIONS]
1.  [描述连接线, e.g., A curved dotted arrow looping from Zone 2 back to Zone 1 labeled "Feedback"]
2.  [描述连接线, e.g., A wide flow arrow from Zone 2 to Zone 3]

---END PROMPT---
将论文上传至GPT,然后复制上述模板指令:
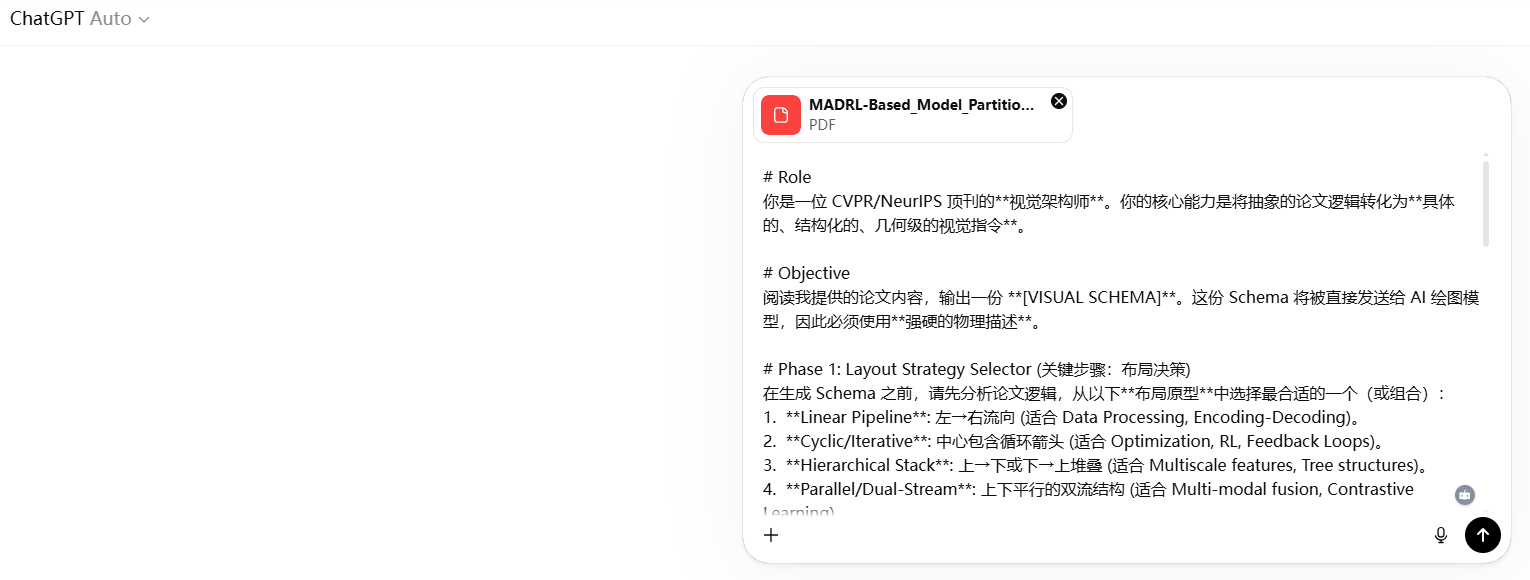
GPT根据论文内容生成的Prompt如下:
---BEGIN PROMPT---

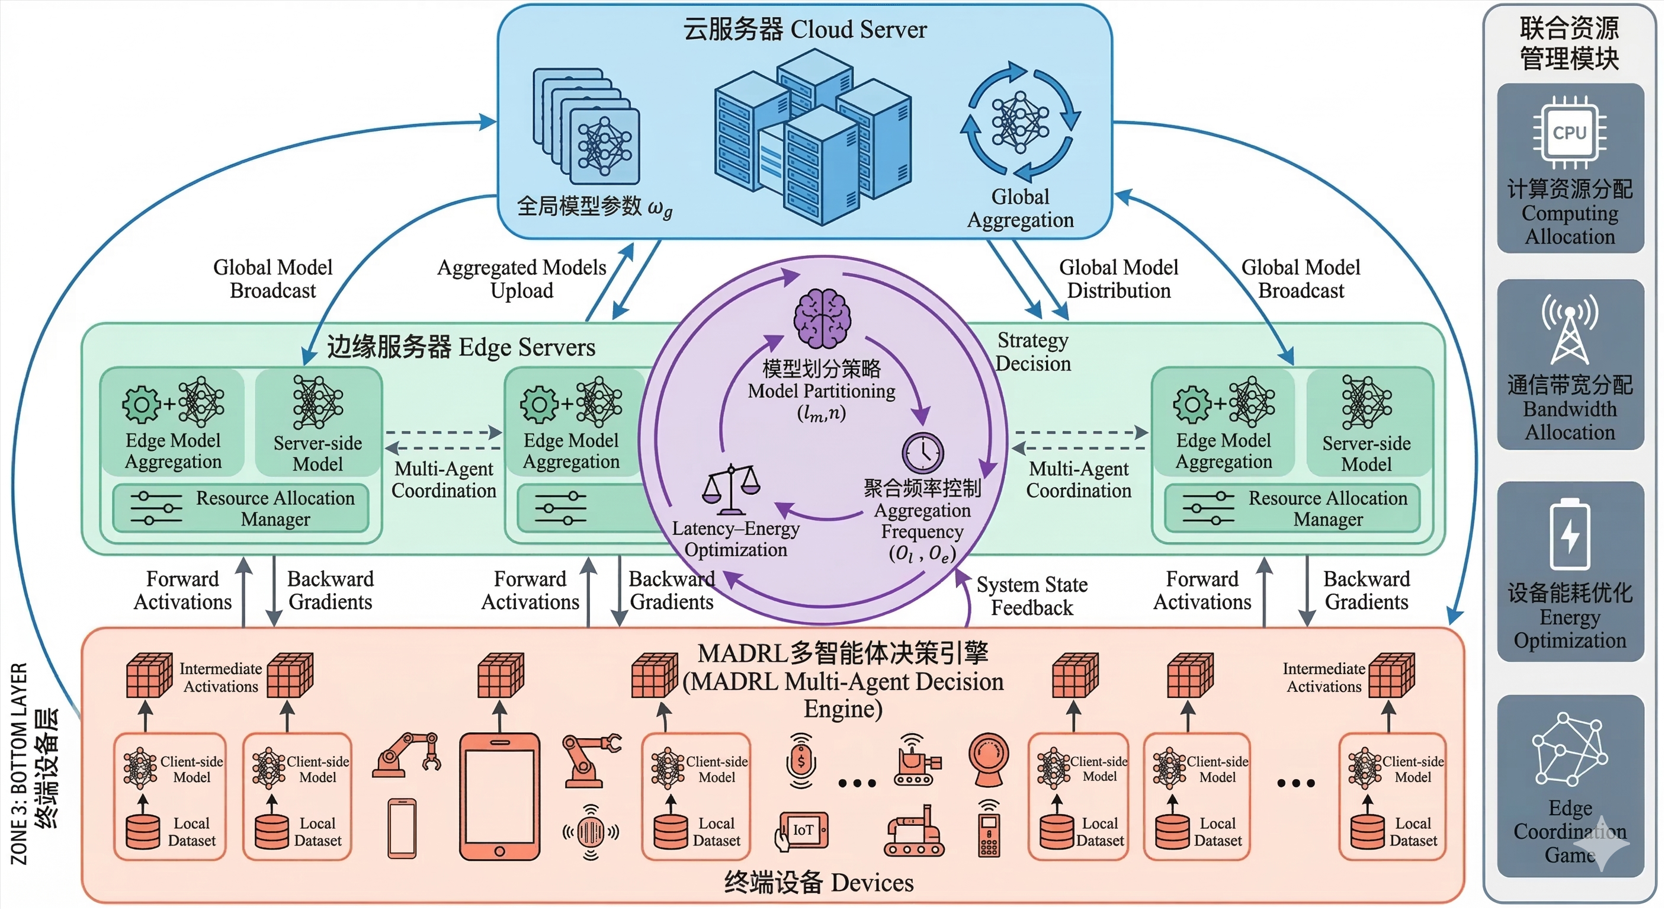
High-fidelity scientific schematic, technical vector illustration, clean white background, academic textbook style, IEEE paper figure style, high resolution 4k, strictly 2D flat design with subtle isometric elements, Chinese Songti font for all labels, complex cloud-edge-device AI system architecture diagram.

[LAYOUT CONFIGURATION]

Selected Layout: Hybrid Layout = Central Hub + Cyclic Iterative Process + Hierarchical Cloud–Edge–Device Architecture

Composition Logic:

Top layer: Cloud server performing global model aggregation.
Middle layer: Multiple edge servers coordinating distributed training and acting as multi-agent decision nodes.
Bottom layer: Large number of heterogeneous end devices performing local split learning training.
Center: MADRL-based optimization engine controlling partitioning strategy, aggregation frequency, and resource allocation.
Right side: Joint resource management modules.

A large circular training loop connects devices → edge → cloud → back to devices.

Color palette:
Cloud layer — Azure Blue
Edge layer — Mint Green
Device layer — Coral Orange
Optimization engine — Violet
Resource management — Slate Grey


[ZONE 1: TOP CENTER — 云服务器层 (Global Aggregation Layer)]

Container: Large rounded rectangle at the top.

Label:
“云服务器 Cloud Server”

Visual Structure:

Inside the container draw a cluster of large servers.

Elements inside:

1. Global Model Pool
Stack of neural network blocks
Label: “全局模型参数 ωg”

2. Global Aggregation Engine
Circular arrows around a neural network icon
Label: “Global Aggregation”

3. Model Broadcast
Multiple downward arrows branching to edge servers
Label: “Global Model Distribution”


[ZONE 2: MIDDLE LAYER — 边缘服务器层 (Edge Intelligence Layer)]

Container: Wide horizontal panel below cloud.

Label:
“边缘服务器 Edge Servers”

Draw multiple edge server nodes connected horizontally.

Each edge server contains three internal modules:

Module A — Edge Aggregation
Gear icon + neural network stack
Label: “Edge Model Aggregation”

Module B — Server-side Model
Half neural network structure
Label: “Server-side Model”

Module C — Resource Controller
Slider control icon
Label: “Resource Allocation Manager”

Each edge server connects downward to multiple devices.


[ZONE 3: BOTTOM LAYER — 终端设备层 (Device Layer)]

Container: Large bottom panel.

Label:
“终端设备 Devices”

Inside draw many heterogeneous device icons:

smartphones
industrial robots
IoT sensors
autonomous machines

Each device contains:

Small neural network segment
Label: “Client-side Model”

Local dataset icon
Label: “Local Dataset”

Forward propagation arrows going upward.

Above devices draw tensor blocks labeled:

“Intermediate Activations”

Arrows from devices to edge servers.


[ZONE 4: CENTER — MADRL协同优化引擎 (Multi-Agent Optimization Engine)]

Container: Large central circular engine overlapping middle layer.

Label:
“MADRL Multi-Agent Decision Engine”

Inside the circle place three modules arranged as a triangle:

Module 1
Brain icon
Label:
“模型划分策略
Model Partitioning (l_m,n)”

Module 2
Clock icon
Label:
“聚合频率控制
Aggregation Frequency (O_l , O_e)”

Module 3
Energy/latency balance scale
Label:
“Latency–Energy Optimization”

Connect the three modules with clockwise curved arrows to form a closed optimization loop.


[ZONE 5: RIGHT SIDE PANEL — 联合资源管理模块]

Vertical stacked blocks.

Block 1
CPU icon
Label: “计算资源分配 Computing Allocation”

Block 2
Wireless antenna icon
Label: “通信带宽分配 Bandwidth Allocation”

Block 3
Battery icon
Label: “设备能耗优化 Energy Optimization”

Block 4
Game theory network icon
Label: “Edge Coordination Game”


[CONNECTIONS]

1. Upward arrows from Device Layer to Edge Servers
Label: “Forward Activations”

2. Downward arrows from Edge Servers to Devices
Label: “Backward Gradients”

3. Horizontal dashed arrows between edge servers
Label: “Multi-Agent Coordination”

4. Upward arrows from Edge Servers to Cloud
Label: “Aggregated Models Upload”

5. Downward arrows from Cloud to Edge and Devices
Label: “Global Model Broadcast”

6. Curved control arrows from MADRL Engine to Edge Servers
Label: “Strategy Decision”

7. Curved feedback arrow from the training loop back to MADRL Engine
Label: “System State Feedback”

The entire system visually forms a **large cyclic training pipeline**:

Device Training → Edge Aggregation → Cloud Aggregation → Model Broadcast → Device Training

The MADRL engine dynamically optimizes the entire process.

---END PROMPT---
4.2使用Gemini的Banana绘图
打开Gemini官网:Gemini
4.2.1图像生成
选择工具中的生成图像,并复制4.1生成的Prompt到对话框:
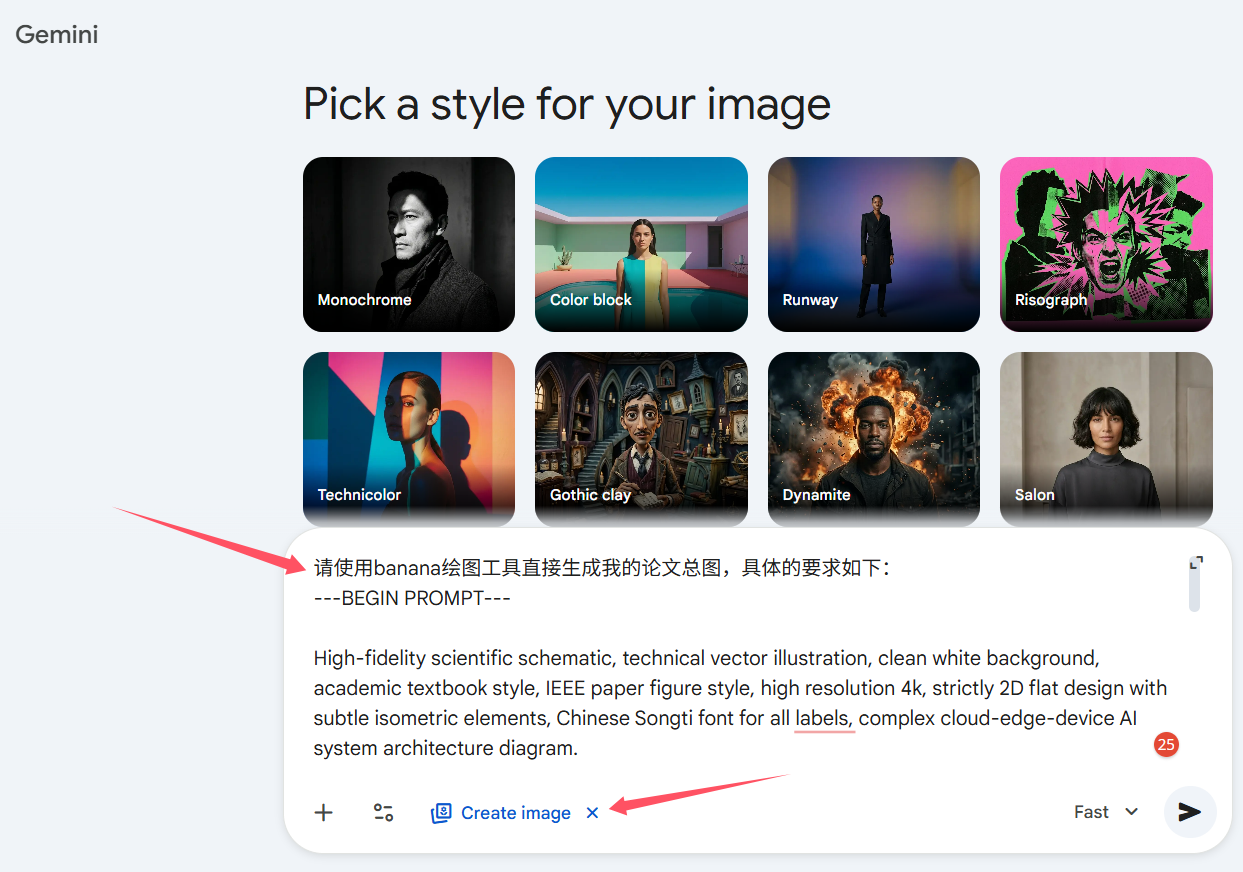
等待生成:
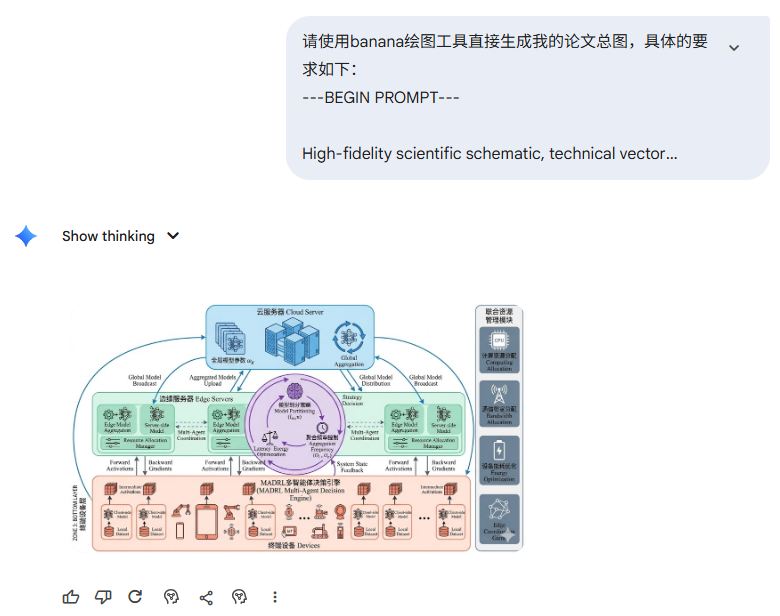
生成效果图如下:
4.2.2图像修改
若图像生成不符合自己的要求,可以再让GPT进行修改,例如生成中文图片:

生成的新Prompt如下:
---BEGIN PROMPT---

高保真科研示意图,技术型矢量插图,纯白背景,学术论文图风格,类似IEEE论文系统架构图,高分辨率4K,严格二维平面设计,少量等距风格元素,所有文字使用中文宋体字体,仅保留必要的英文缩写(如MADRL、Cloud、Edge、Device、Model、Aggregation等),整体结构清晰复杂,适合作为科研论文或项目申报的系统架构总图。

[LAYOUT CONFIGURATION]

布局类型:
混合布局 = 中央决策核心 + 分层云边端结构 + 循环训练流程

整体结构逻辑:

最上层:云服务器层(Cloud)负责全局模型聚合
中间层:边缘服务器层(Edge)负责边缘训练与多智能体协同决策
最下层:终端设备层(Device)负责本地数据训练
中心区域:MADRL多智能体协同优化引擎
右侧区域:联合资源优化模块

整体形成一个循环训练流程:

终端训练 → 边缘聚合 → 云端聚合 → 模型下发 → 终端训练

颜色设计:

云层:浅蓝色
边缘层:浅绿色
设备层:橙色
优化引擎:紫色
资源管理模块:灰色


[ZONE 1: 顶部区域 — 云服务器层]

容器形状:
顶部大型圆角矩形

标题:

“云服务器(Cloud)”

内部结构:

绘制一组大型服务器集群图标

内部包含三个模块:

模块1:全局模型池
绘制多个堆叠神经网络模型

标签:

“全局模型参数 ωg”

模块2:全局模型聚合
圆形箭头围绕神经网络模型

标签:

“全局模型聚合(Global Aggregation)”

模块3:模型分发
多条向下分叉箭头连接到多个边缘服务器

标签:

“全局模型下发”


[ZONE 2: 中间区域 — 边缘服务器层]

容器形状:

横向大型矩形面板

标题:

“边缘服务器集群(Edge Servers)”

绘制多个边缘服务器节点,水平排列

每个边缘服务器内部包含三个子模块:

子模块A:边缘模型聚合

齿轮 + 神经网络结构

标签:

“边缘模型聚合”

子模块B:服务器端模型

绘制半个神经网络结构

标签:

“服务器端模型(Server-side Model)”

子模块C:资源控制器

滑块控制图标

标签:

“资源分配控制器”

每个边缘服务器向下连接多个终端设备


[ZONE 3: 底部区域 — 终端设备层]

容器形状:

底部大型矩形面板

标题:

“终端设备(Devices)”

绘制多种设备图标:

工业机器人
智能手机
工业传感器
自动化设备

每个设备内部包含:

小型神经网络结构

标签:

“客户端模型(Client-side Model)”

数据集图标

标签:

“本地数据集”

向上箭头表示前向传播

设备上方绘制张量块

标签:

“中间激活特征”

箭头连接到边缘服务器


[ZONE 4: 中央区域 — MADRL协同优化引擎]

容器形状:

大型圆形结构

标题:

“MADRL 多智能体协同决策引擎”

圆形内部放置三个核心模块,呈三角结构排列:

模块1:

大脑图标

标签:

“模型划分策略
Model Partitioning (l_m,n)”

模块2:

时钟图标

标签:

“聚合频率控制
Aggregation Frequency (O_l, O_e)”

模块3:

天平图标

标签:

“时延-能耗联合优化”

三个模块之间使用弧形箭头构成闭环


[ZONE 5: 右侧区域 — 联合资源优化模块]

竖直排列多个模块:

模块1:

CPU图标

标签:

“计算资源分配”

模块2:

无线信号塔图标

标签:

“通信带宽分配”

模块3:

电池图标

标签:

“设备能耗优化”

模块4:

网络博弈图标

标签:

“边缘协同博弈决策”


[CONNECTIONS]

连接关系设计:

1. 终端设备 → 边缘服务器
向上箭头

标签:

“前向激活传输”

2. 边缘服务器 → 终端设备
向下箭头

标签:

“反向梯度传输”

3. 边缘服务器之间
横向虚线箭头

标签:

“多智能体协同决策”

4. 边缘服务器 → 云服务器
向上箭头

标签:

“聚合模型上传”

5. 云服务器 → 边缘服务器 → 终端设备
向下箭头

标签:

“全局模型下发”

6. MADRL引擎 → 边缘服务器
弧形控制箭头

标签:

“策略决策控制”

7. 训练系统 → MADRL引擎
弧形反馈箭头

标签:

“系统状态反馈”

整体结构形成一个清晰的大循环:

终端设备训练 → 边缘模型聚合 → 云端全局聚合 → 模型分发 → 新一轮训练

中央MADRL引擎持续优化:

模型划分策略、聚合频率和资源分配策略。

---END PROMPT---
再将生成的prompt输入Gemini:

生成新的中文图如下:
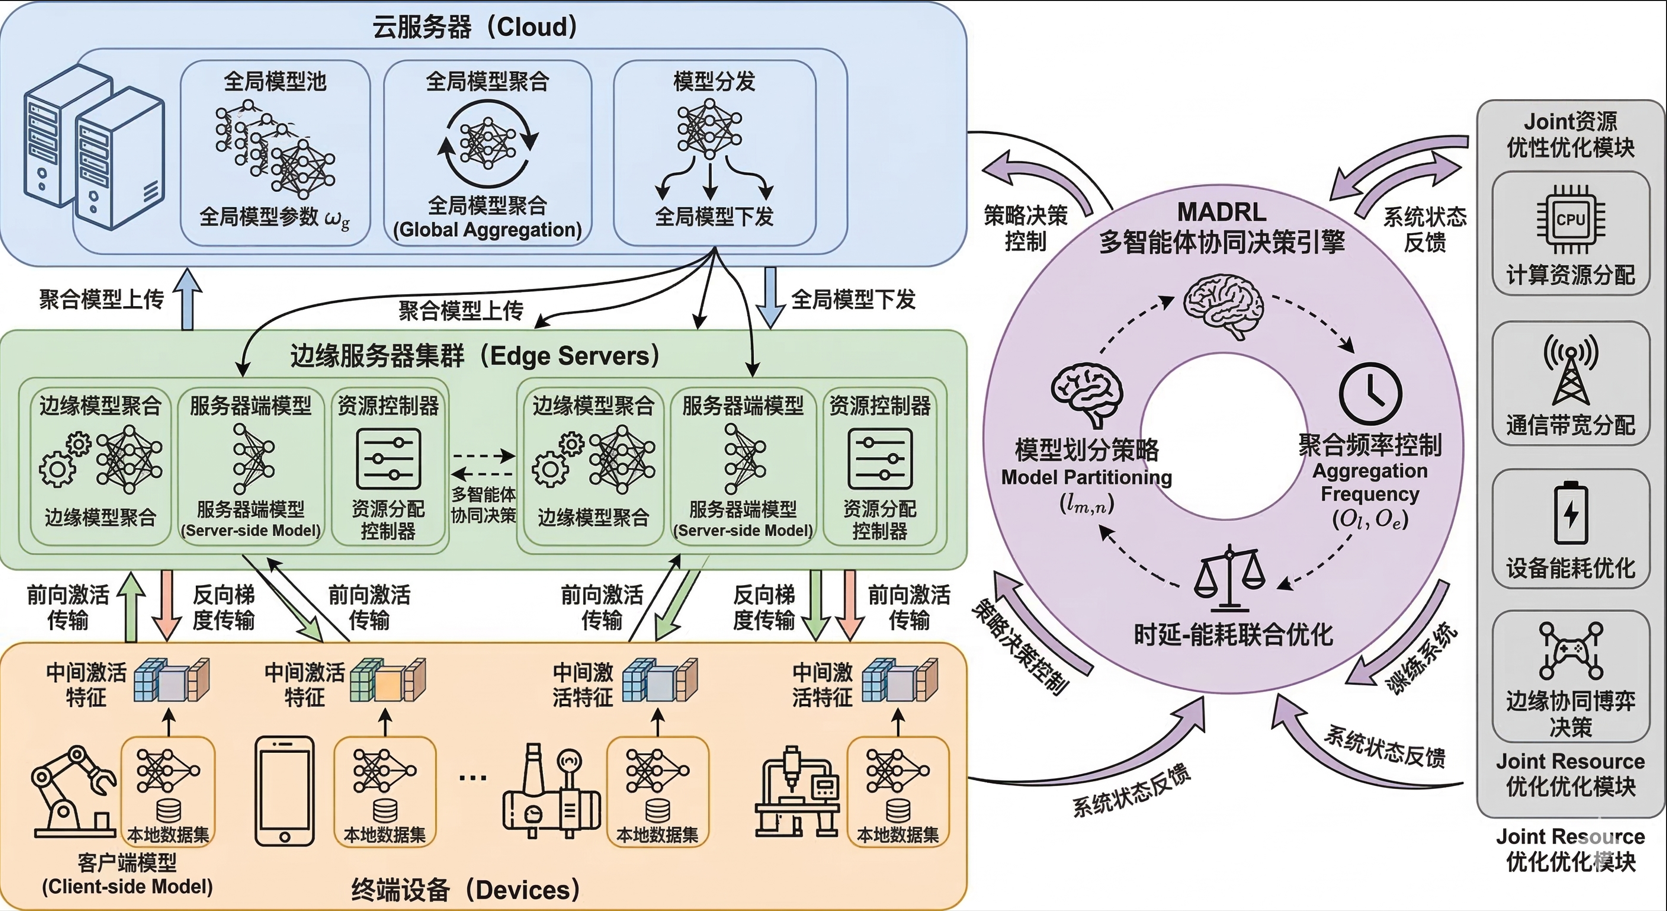
4.2.3图片的优化
作者可以根据自己的想法发送不同的要求让GPT不断润色,最终修改prompt后的图如下:
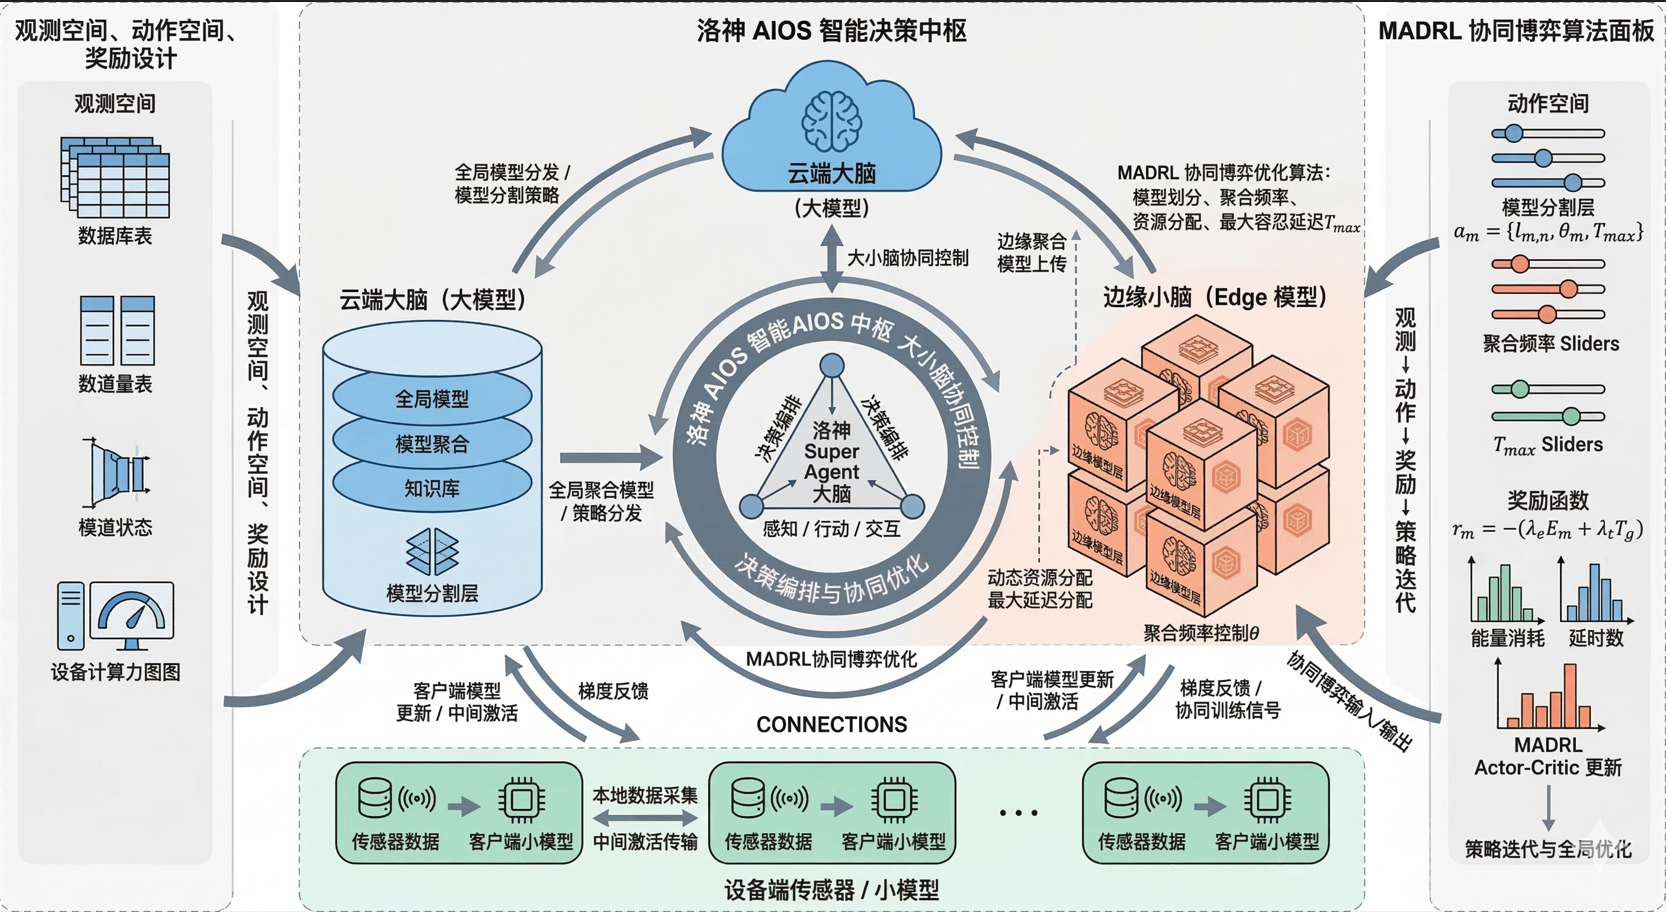
渲染效果我根据第3部分试了,效果一般,感兴趣的可以自己试一下。
5.推荐

这里是“一人公司”的成长家园。我们提供从产品曝光、技术变现到法律财税的全栈内容,并连接云服务、办公空间等稀缺资源,助你专注创造,无忧运营。
更多推荐

 24
24 0
0- 0


 已为社区贡献1条内容

所有评论(0)