Xshell高效运维实战指南
Xshell高效运维指南:从基础到自动化实践 本文全面解析Xshell在服务器管理中的高阶应用,涵盖会话管理、安全配置、自动化脚本及DevOps集成。核心内容包括:1)多协议支持与标签式会话管理;2)双因素认证与密钥轮换方案;3)Python/VBScript自动化脚本范例;4)服务器集群批量管理框架;5)实时监控告警系统实现;6)与Ansible/Jenkins的深度集成。通过端口转发、多层跳板
一、Xshell核心价值与定位
1.1 Xshell在现代化运维中的地位
Xshell作为业界领先的SSH客户端,在服务器管理中扮演着至关重要的角色。它不仅提供了安全的远程连接功能,更通过强大的脚本支持和自动化能力,成为DevOps工程师和系统管理员的核心工具。
关键优势:
-
多协议支持(SSH1/SSH2, SFTP, TELNET, RLOGIN, SERIAL)
-
标签式界面与多会话管理
-
强大的脚本语言支持(VBScript, JScript, Python)
-
安全的密码管理和密钥代理
-
高级端口转发功能
二、Xshell高阶技巧详解
2.1 会话管理与组织策略
2.1.1 智能会话分组
xml
<!-- 会话配置文件示例 -->
<Session>
  <Group name="Production-Servers">
    <Session name="Web-Server-01" host="192.168.1.10" port="22" protocol="SSH"/>
    <Session name="DB-Server-01" host="192.168.1.20" port="22" protocol="SSH"/>
  </Group>
  <Group name="Development">
    <Session name="Dev-Web-01" host="10.0.0.10" port="22" protocol="SSH"/>
  </Group>
</Session>
2.1.2 会话模板化配置
vbscript
' 创建会话模板的VBScript脚本
Sub CreateSessionTemplate
    Dim objXsh
    Set objXsh = CreateObject("Xshell.Session")

    ' 通用配置
    objXsh.Name = "Linux-Template"
    objXsh.Host = "$HOST$"
    objXsh.Port = 22
    objXsh.Protocol = "SSH"
    objXsh.UserName = "admin"

    ' 终端设置
    objXsh.TerminalType = "xterm"
    objXsh.Rows = 40
    objXsh.Columns = 120
    objXsh.ColorScheme = "Linux Colors"

    ' 保存为模板
    objXsh.SaveAsTemplate "Linux-Base"
End Sub
2.2 高级安全配置
2.2.1 双因素认证集成
python
# Python脚本实现双因素认证自动化
import pyotp
import time
import subprocess

class TwoFactorAuth:
    def __init__(self, secret_key):
        self.totp = pyotp.TOTP(secret_key)

    def get_current_token(self):
        return self.totp.now()

    def automate_xshell_login(self, host, username, password):
        # 生成当前TOTP令牌
        token = self.get_current_token()

        # 构建完整密码(密码+令牌)
        full_password = f"{password}{token}"

        # 使用Xshell命令行连接
        cmd = f'xshell.exe /T /N "{host}" /P:{full_password}'
        subprocess.run(cmd, shell=True)

# 使用示例
auth = TwoFactorAuth("JBSWY3DPEHPK3PXP")
auth.automate_xshell_login("server1.example.com", "admin", "basepassword")
2.2.2 密钥管理与轮换自动化
bash
#!/bin/bash
# 自动密钥轮换脚本
KEY_DIR="/etc/ssh/keys"
BACKUP_DIR="/backup/ssh_keys"
DATE=$(date +%Y%m%d_%H%M%S)

# 生成新密钥
ssh-keygen -t ed25519 -f "${KEY_DIR}/ssh_host_ed25519_key_${DATE}" -N ""

# 备份旧密钥
cp /etc/ssh/ssh_host_* "${BACKUP_DIR}/"

# 更新配置文件
sed -i "s|HostKey.*ssh_host_ed25519_key|HostKey ${KEY_DIR}/ssh_host_ed25519_key_${DATE}|" /etc/ssh/sshd_config

# 重启SSH服务
systemctl restart sshd

# 分发新公钥到所有服务器
for server in $(cat /etc/server_list.txt); do
    ssh-copy-id -i "${KEY_DIR}/ssh_host_ed25519_key_${DATE}.pub" admin@$server
done
2.3 高级端口转发与隧道技术
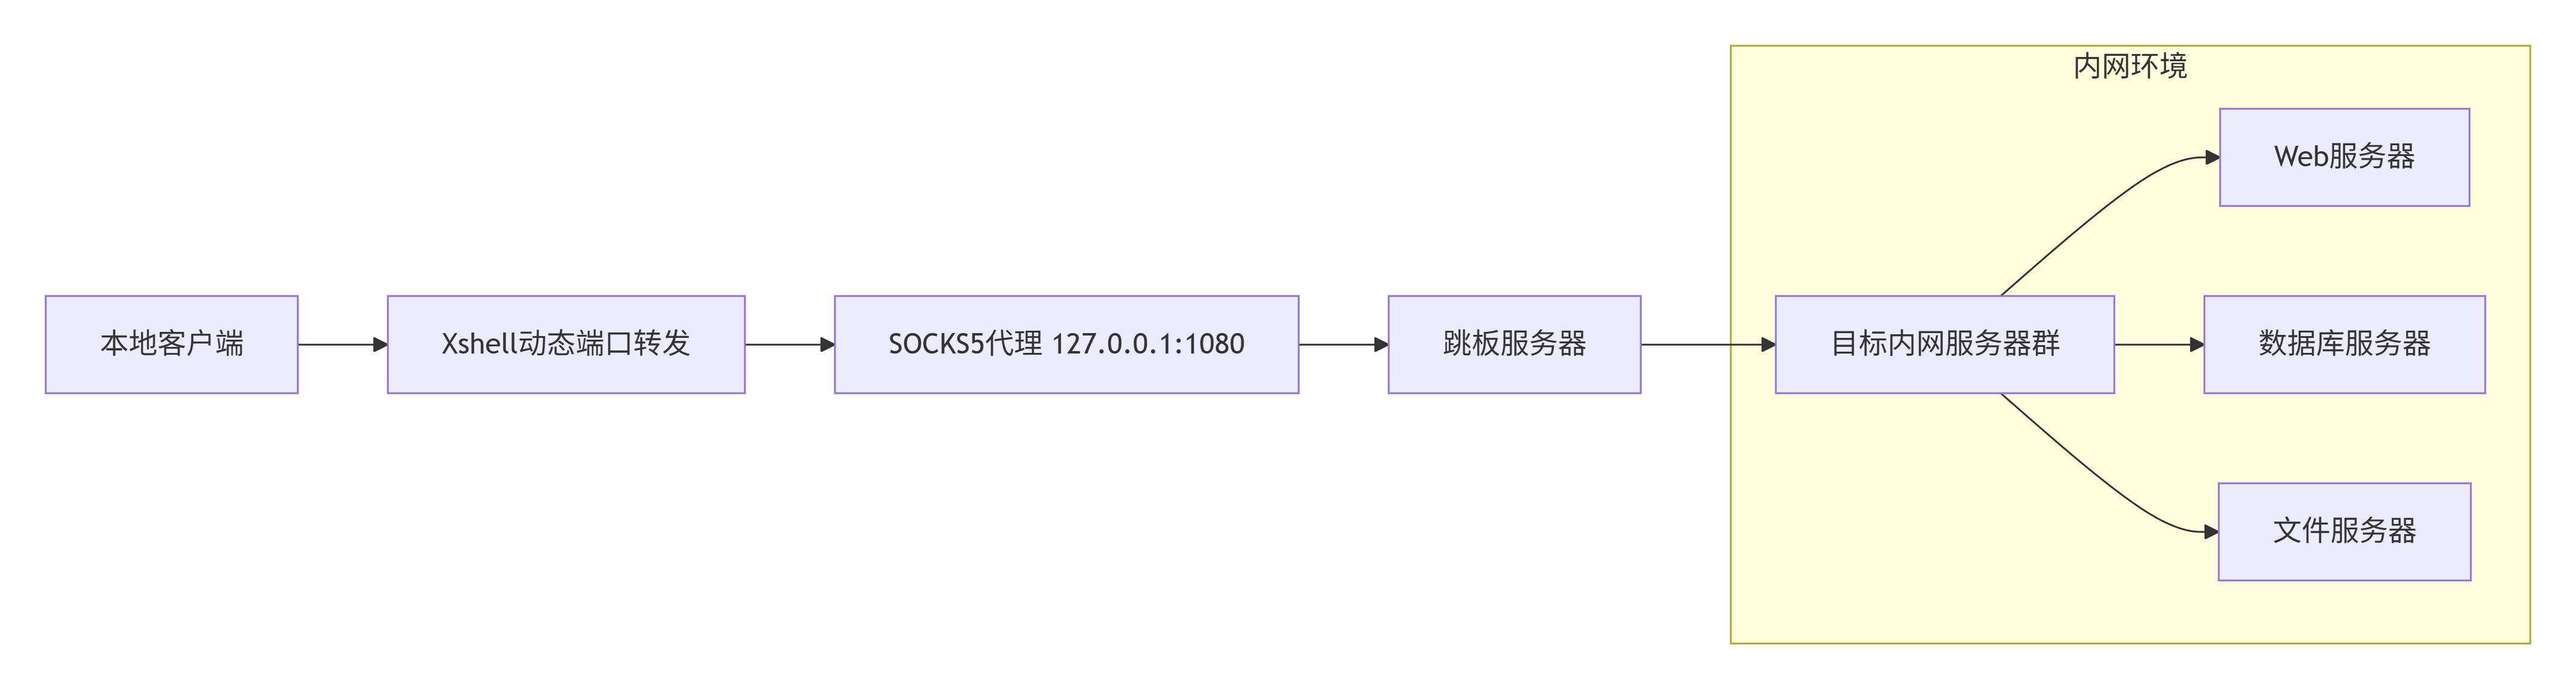
2.3.1 动态SOCKS代理配置
graph LR
    A[本地客户端] --> B[Xshell动态端口转发]
    B --> C[SOCKS5代理 127.0.0.1:1080]
    C --> D[跳板服务器]
    D --> E[目标内网服务器群]

    subgraph "内网环境"
        E --> F[Web服务器]
        E --> G[数据库服务器]
        E --> H[文件服务器]
    end
2.3.2 多层跳板连接
vbscript
' 多级跳板连接的VBScript实现
Function CreateJumpSession
    Dim xsh, session1, session2

    ' 创建Xshell对象
    Set xsh = CreateObject("Xshell.Application")

    ' 第一跳服务器
    Set session1 = xsh.Sessions.Add("JumpServer1")
    session1.Host = "jump1.example.com"
    session1.UserName = "admin"
    session1.Password = "password1"

    ' 配置本地端口转发
    session1.AddForwarding "L", 2222, "target.internal.com", 22

    ' 第二跳连接
    Set session2 = xsh.Sessions.Add("TargetServer")
    session2.Host = "127.0.0.1"
    session2.Port = 2222
    session2.UserName = "internal_user"

    ' 连接
    session1.Connect
    WScript.Sleep 3000  ' 等待连接建立
    session2.Connect
End Function
三、Xshell自动化脚本实战
3.1 服务器集群批量管理
3.1.1 批量执行命令框架
python
# server_manager.py - 服务器集群批量管理工具
import paramiko
import concurrent.futures
import json
from typing import List, Dict
import logging

class ServerClusterManager:
    def __init__(self, config_file: str = "servers.json"):
        self.logger = self.setup_logger()
        self.servers = self.load_config(config_file)
        self.results = {}

    def setup_logger(self):
        logging.basicConfig(
            level=logging.INFO,
            format='%(asctime)s - %(levelname)s - %(message)s',
            handlers=[
                logging.FileHandler('server_operations.log'),
                logging.StreamHandler()
            ]
        )
        return logging.getLogger(__name__)

    def load_config(self, config_file: str) -> List[Dict]:
        with open(config_file, 'r') as f:
            config = json.load(f)
        return config['servers']

    def execute_command(self, server: Dict, command: str) -> Dict:
        """在单个服务器上执行命令"""
        try:
            ssh = paramiko.SSHClient()
            ssh.set_missing_host_key_policy(paramiko.AutoAddPolicy())

            # 连接服务器
            ssh.connect(
                hostname=server['host'],
                port=server.get('port', 22),
                username=server['username'],
                key_filename=server.get('key_path'),
                timeout=10
            )

            # 执行命令
            stdin, stdout, stderr = ssh.exec_command(command)
            output = stdout.read().decode()
            error = stderr.read().decode()
            exit_code = stdout.channel.recv_exit_status()

            ssh.close()

            return {
                'server': server['name'],
                'success': exit_code == 0,
                'output': output,
                'error': error,
                'exit_code': exit_code
            }

        except Exception as e:
            return {
                'server': server['name'],
                'success': False,
                'error': str(e),
                'output': '',
                'exit_code': -1
            }

    def parallel_execute(self, command: str, max_workers: int = 10):
        """并行在多台服务器上执行命令"""
        with concurrent.futures.ThreadPoolExecutor(max_workers=max_workers) as executor:
            future_to_server = {
                executor.submit(self.execute_command, server, command): server
                for server in self.servers
            }

            for future in concurrent.futures.as_completed(future_to_server):
                server = future_to_server[future]
                try:
                    result = future.result()
                    self.results[server['name']] = result

                    if result['success']:
                        self.logger.info(f"{server['name']}: 命令执行成功")
                    else:
                        self.logger.error(f"{server['name']}: 命令执行失败 - {result['error']}")

                except Exception as e:
                    self.logger.error(f"{server['name']}: 执行异常 - {str(e)}")

    def generate_report(self):
        """生成执行报告"""
        report = {
            'total': len(self.servers),
            'success': sum(1 for r in self.results.values() if r['success']),
            'failed': sum(1 for r in self.results.values() if not r['success']),
            'details': self.results
        }

        with open('execution_report.json', 'w') as f:
            json.dump(report, f, indent=2, ensure_ascii=False)

        return report

# 使用示例
if __name__ == "__main__":
    manager = ServerClusterManager("servers.json")

    # 批量执行系统更新
    manager.parallel_execute("apt update && apt upgrade -y", max_workers=5)

    # 生成报告
    report = manager.generate_report()
    print(f"成功: {report['success']}/{report['total']}")
3.1.2 配置文件示例 (servers.json)
json
{
  "servers": [
    {
      "name": "web-server-01",
      "host": "192.168.1.10",
      "username": "admin",
      "key_path": "/path/to/private_key",
      "role": "web",
      "environment": "production"
    },
    {
      "name": "db-server-01",
      "host": "192.168.1.20",
      "username": "admin",
      "key_path": "/path/to/private_key",
      "role": "database",
      "environment": "production"
    },
    {
      "name": "dev-server-01",
      "host": "10.0.0.10",
      "username": "developer",
      "password": "encrypted_password",
      "role": "development",
      "environment": "development"
    }
  ]
}
3.2 自动化监控与告警系统
3.2.1 实时监控脚本
python
# monitoring_system.py - 自动化监控系统
import time
import psutil
import requests
from datetime import datetime
import smtplib
from email.mime.text import MIMEText
from threading import Thread
import json

class ServerMonitor:
    def __init__(self, config):
        self.config = config
        self.alert_thresholds = {
            'cpu': 85,      # CPU使用率阈值
            'memory': 90,   # 内存使用率阈值
            'disk': 80,     # 磁盘使用率阈值
            'load': 5.0     # 系统负载阈值
        }
        self.alert_history = []

    def collect_metrics(self):
        """收集系统指标"""
        metrics = {
            'timestamp': datetime.now().isoformat(),
            'cpu_percent': psutil.cpu_percent(interval=1),
            'memory_percent': psutil.virtual_memory().percent,
            'disk_percent': psutil.disk_usage('/').percent,
            'load_avg': psutil.getloadavg()[0],
            'network_io': psutil.net_io_counters()._asdict(),
            'process_count': len(psutil.pids())
        }
        return metrics

    def check_thresholds(self, metrics):
        """检查是否超过阈值"""
        alerts = []

        if metrics['cpu_percent'] > self.alert_thresholds['cpu']:
            alerts.append(f"CPU使用率过高: {metrics['cpu_percent']}%")

        if metrics['memory_percent'] > self.alert_thresholds['memory']:
            alerts.append(f"内存使用率过高: {metrics['memory_percent']}%")

        if metrics['disk_percent'] > self.alert_thresholds['disk']:
            alerts.append(f"磁盘使用率过高: {metrics['disk_percent']}%")

        if metrics['load_avg'] > self.alert_thresholds['load']:
            alerts.append(f"系统负载过高: {metrics['load_avg']}")

        return alerts

    def send_alert(self, alerts, metrics):
        """发送告警通知"""
        alert_time = datetime.now().strftime("%Y-%m-%d %H:%M:%S")

        # 构建告警消息
        message = f"""
        服务器监控告警
        时间: {alert_time}
        服务器: {self.config['server_name']}

        检测到以下问题:
        {chr(10).join(f'- {alert}' for alert in alerts)}

        当前指标:
        - CPU使用率: {metrics['cpu_percent']}%
        - 内存使用率: {metrics['memory_percent']}%
        - 磁盘使用率: {metrics['disk_percent']}%
        - 系统负载: {metrics['load_avg']}

        请及时处理!
        """

        # 发送邮件
        self.send_email(message)

        # 发送Slack通知
        self.send_slack_webhook(message)

        # 记录告警历史
        self.alert_history.append({
            'time': alert_time,
            'alerts': alerts,
            'metrics': metrics
        })

    def send_email(self, message):
        """发送邮件告警"""
        msg = MIMEText(message, 'plain', 'utf-8')
        msg['Subject'] = f"服务器告警 - {self.config['server_name']}"
        msg['From'] = self.config['email']['sender']
        msg['To'] = ', '.join(self.config['email']['recipients'])

        try:
            with smtplib.SMTP(self.config['email']['smtp_server'],
                            self.config['email']['smtp_port']) as server:
                server.starttls()
                server.login(self.config['email']['username'],
                           self.config['email']['password'])
                server.send_message(msg)
                print("邮件告警发送成功")
        except Exception as e:
            print(f"邮件发送失败: {e}")

    def send_slack_webhook(self, message):
        """发送Slack通知"""
        if 'slack_webhook' not in self.config:
            return

        payload = {
            'text': message,
            'username': 'Server Monitor Bot',
            'icon_emoji': ':warning:'
        }

        try:
            response = requests.post(
                self.config['slack_webhook'],
                json=payload,
                timeout=5
            )
            if response.status_code == 200:
                print("Slack通知发送成功")
        except Exception as e:
            print(f"Slack通知发送失败: {e}")

    def start_monitoring(self, interval=60):
        """启动监控循环"""
        print(f"开始监控服务器: {self.config['server_name']}")

        while True:
            try:
                # 收集指标
                metrics = self.collect_metrics()

                # 检查阈值
                alerts = self.check_thresholds(metrics)

                # 如果有告警则发送通知
                if alerts:
                    self.send_alert(alerts, metrics)

                # 记录指标(可存储到数据库)
                self.log_metrics(metrics)

                # 等待下一个检查周期
                time.sleep(interval)

            except KeyboardInterrupt:
                print("监控已停止")
                break
            except Exception as e:
                print(f"监控出错: {e}")
                time.sleep(interval)

    def log_metrics(self, metrics):
        """记录指标到文件"""
        with open('metrics_log.json', 'a') as f:
            log_entry = {
                'server': self.config['server_name'],
                **metrics
            }
            f.write(json.dumps(log_entry) + '\n')

# 监控配置文件
monitor_config = {
    'server_name': 'production-web-01',
    'email': {
        'smtp_server': 'smtp.example.com',
        'smtp_port': 587,
        'username': 'monitor@example.com',
        'password': 'your_password',
        'sender': 'monitor@example.com',
        'recipients': ['admin@example.com', 'ops@example.com']
    },
    'slack_webhook': 'https://hooks.slack.com/services/XXX/YYY/ZZZ'
}

# 启动监控
monitor = ServerMonitor(monitor_config)
monitor.start_monitoring(interval=300)  # 每5分钟检查一次
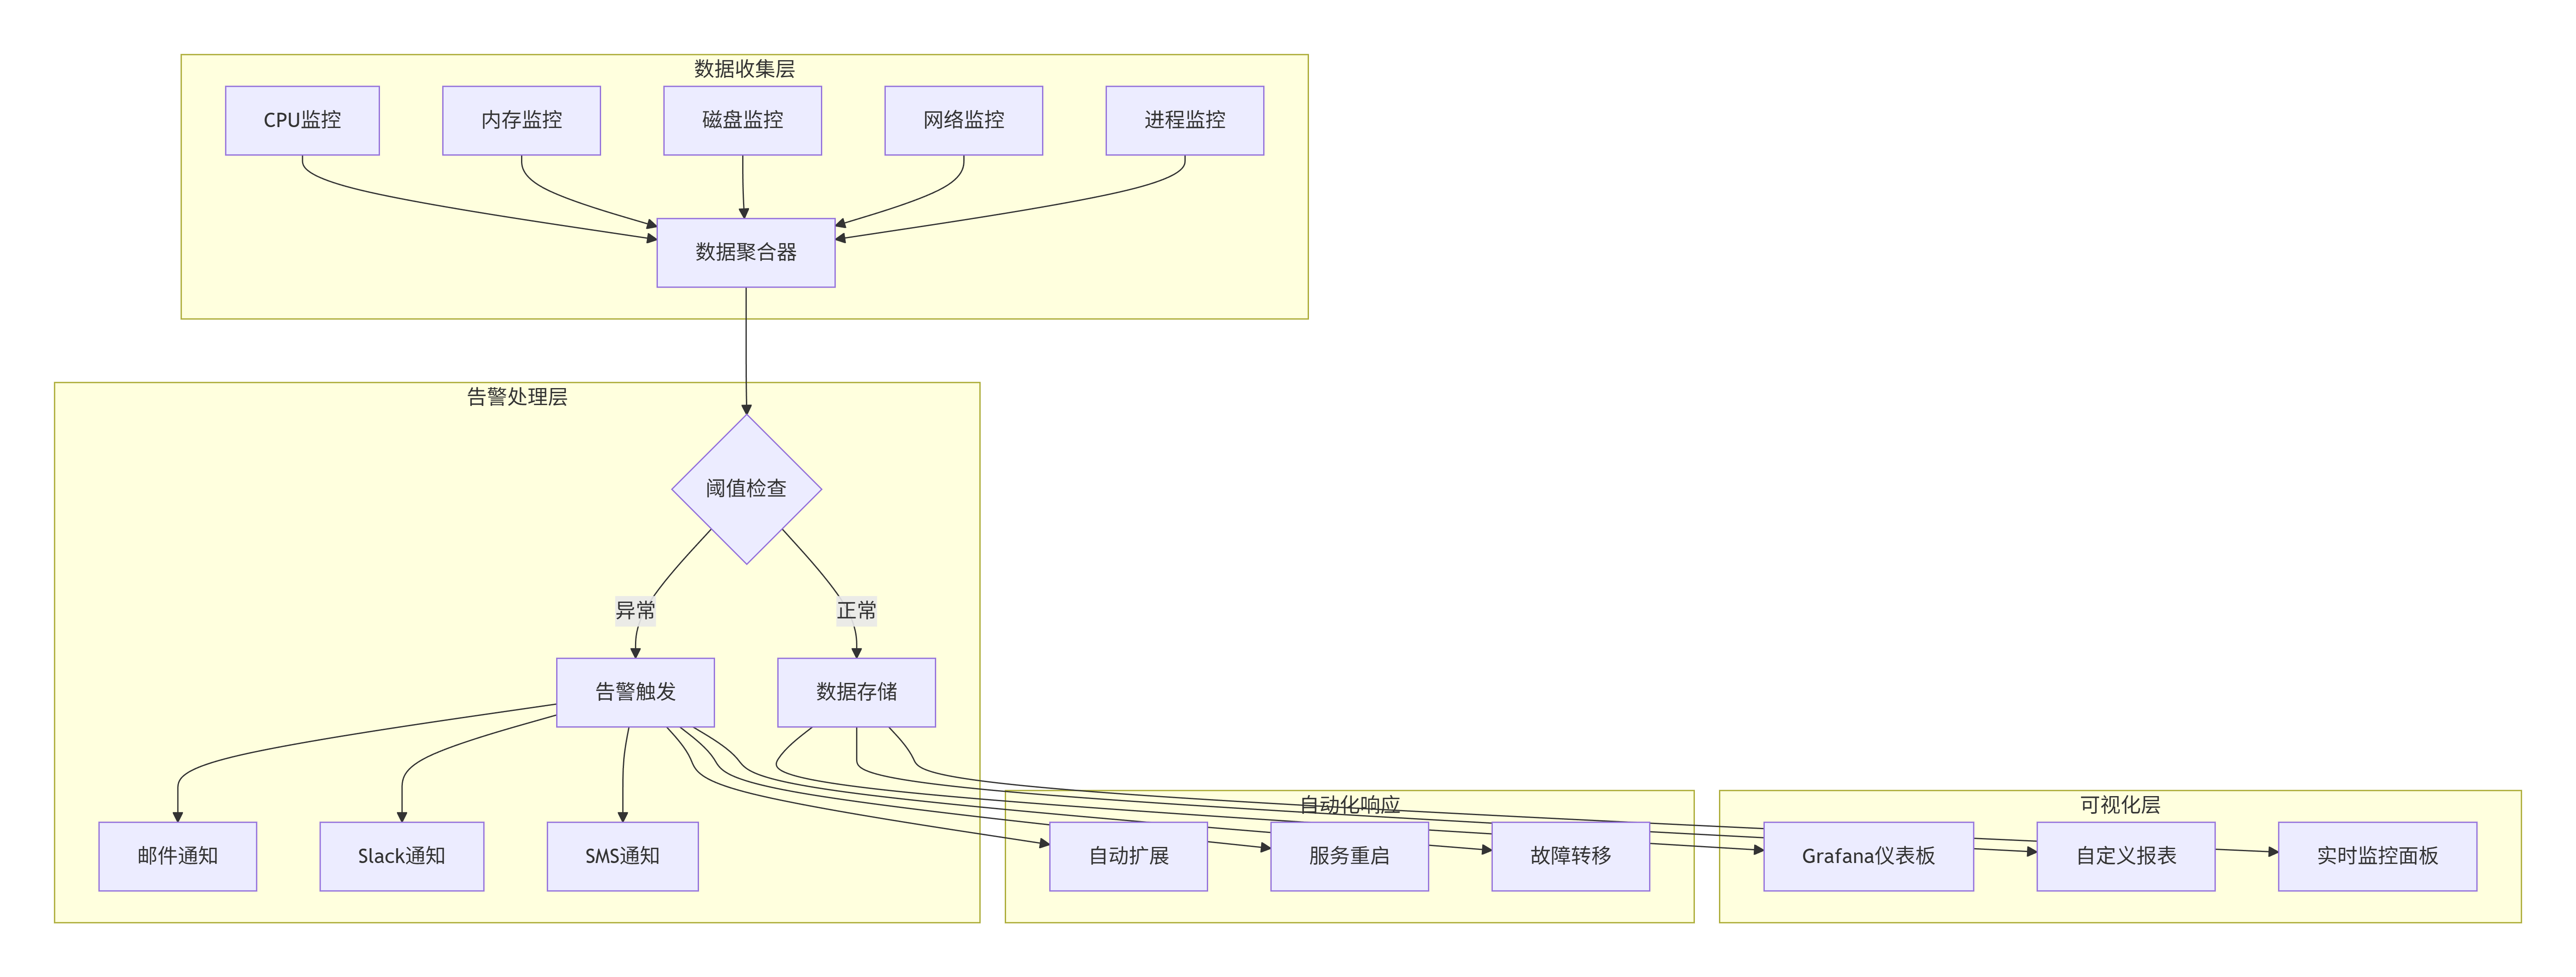
3.2.2 监控数据可视化
graph TB
    subgraph "数据收集层"
        A1[CPU监控] --> B[数据聚合器]
        A2[内存监控] --> B
        A3[磁盘监控] --> B
        A4[网络监控] --> B
        A5[进程监控] --> B
    end

    subgraph "告警处理层"
        B --> C{阈值检查}
        C -->|正常| D[数据存储]
        C -->|异常| E[告警触发]
        E --> F[邮件通知]
        E --> G[Slack通知]
        E --> H[SMS通知]
    end

    subgraph "可视化层"
        D --> I[Grafana仪表板]
        D --> J[自定义报表]
        D --> K[实时监控面板]
    end

    subgraph "自动化响应"
        E --> L[自动扩展]
        E --> M[服务重启]
        E --> N[故障转移]
    end
3.3 自动化部署流水线
3.3.1 完整部署脚本
python
# deploy_pipeline.py - 自动化部署流水线
import os
import sys
import tarfile
import shutil
from pathlib import Path
import git
import docker
import yaml
from fabric import Connection
from invoke import Responder

class DeploymentPipeline:
    def __init__(self, config_path="deploy_config.yaml"):
        self.config = self.load_config(config_path)
        self.env = os.environ.get('DEPLOY_ENV', 'staging')
        self.deployment_log = []

    def load_config(self, config_path):
        with open(config_path, 'r') as f:
            return yaml.safe_load(f)

    def log_step(self, step, message, status="INFO"):
        log_entry = f"[{status}] {step}: {message}"
        self.deployment_log.append(log_entry)
        print(log_entry)

    def git_pull(self):
        """拉取最新代码"""
        self.log_step("Git", "开始拉取最新代码")

        try:
            repo = git.Repo(self.config['project_path'])
            current_branch = repo.active_branch.name

            # 拉取最新代码
            origin = repo.remote(name='origin')
            origin.pull()

            self.log_step("Git", f"代码更新完成,当前分支: {current_branch}")
            return True
        except Exception as e:
            self.log_step("Git", f"代码更新失败: {str(e)}", "ERROR")
            return False

    def run_tests(self):
        """运行测试"""
        self.log_step("测试", "开始运行测试")

        test_cmd = self.config['test_command']
        result = os.system(test_cmd)

        if result == 0:
            self.log_step("测试", "所有测试通过")
            return True
        else:
            self.log_step("测试", "测试失败,部署中止", "ERROR")
            return False

    def build_docker_image(self):
        """构建Docker镜像"""
        self.log_step("Docker", "开始构建镜像")

        try:
            client = docker.from_env()

            # 构建镜像
            image, build_logs = client.images.build(
                path=self.config['project_path'],
                tag=f"{self.config['app_name']}:{self.config['version']}",
                dockerfile="Dockerfile"
            )

            # 输出构建日志
            for chunk in build_logs:
                if 'stream' in chunk:
                    print(chunk['stream'].strip())

            self.log_step("Docker", f"镜像构建完成: {image.tags[0]}")
            return image
        except Exception as e:
            self.log_step("Docker", f"镜像构建失败: {str(e)}", "ERROR")
            return None

    def deploy_to_server(self, server_config, image):
        """部署到目标服务器"""
        self.log_step("部署", f"开始部署到服务器: {server_config['host']}")

        try:
            # 建立SSH连接
            connect_kwargs = {}
            if 'key_path' in server_config:
                connect_kwargs['key_filename'] = server_config['key_path']

            conn = Connection(
                host=server_config['host'],
                user=server_config['user'],
                connect_kwargs=connect_kwargs,
                connect_timeout=30
            )

            # 上传部署脚本
            deploy_script = self.create_deploy_script(server_config, image)
            remote_path = f"/tmp/deploy_{self.config['app_name']}.sh"

            conn.put(deploy_script, remote_path)
            conn.run(f"chmod +x {remote_path}")

            # 执行部署脚本
            result = conn.run(f"sudo {remote_path}", warn=True)

            if result.ok:
                self.log_step("部署", f"服务器 {server_config['host']} 部署成功")
                return True
            else:
                self.log_step("部署", f"服务器 {server_config['host']} 部署失败", "ERROR")
                return False

        except Exception as e:
            self.log_step("部署", f"连接服务器失败: {str(e)}", "ERROR")
            return False

    def create_deploy_script(self, server_config, image):
        """创建部署脚本"""
        script = f"""#!/bin/bash
# 自动化部署脚本
set -e

echo "开始部署 {self.config['app_name']}"

# 停止现有容器
docker stop {self.config['app_name']} || true
docker rm {self.config['app_name']} || true

# 拉取新镜像
docker pull {image.tags[0]}

# 运行新容器
docker run -d \\
  --name {self.config['app_name']} \\
  --restart=always \\
  -p {server_config['port']}:{self.config['app_port']} \\
  -v {server_config['data_path']}:/app/data \\
  {image.tags[0]}

echo "部署完成"
"""
        return script

    def rollback(self, version):
        """回滚到指定版本"""
        self.log_step("回滚", f"开始回滚到版本: {version}")

        # 实现回滚逻辑
        # ...

        self.log_step("回滚", "回滚完成")

    def run_pipeline(self):
        """运行完整部署流水线"""
        self.log_step("流水线", "开始自动化部署流水线")

        # 1. 代码更新
        if not self.git_pull():
            return False

        # 2. 运行测试
        if not self.run_tests():
            return False

        # 3. 构建镜像
        image = self.build_docker_image()
        if not image:
            return False

        # 4. 部署到所有服务器
        deployment_results = []
        for server in self.config['servers']:
            if server['environment'] == self.env:
                success = self.deploy_to_server(server, image)
                deployment_results.append(success)

        # 5. 验证部署
        all_success = all(deployment_results)

        if all_success:
            self.log_step("流水线", "所有服务器部署成功")

            # 发送部署成功通知
            self.send_deployment_notification(success=True)
        else:
            self.log_step("流水线", "部分服务器部署失败,开始回滚", "ERROR")

            # 回滚到上一个版本
            self.rollback(self.config['previous_version'])

            # 发送部署失败通知
            self.send_deployment_notification(success=False)

        # 保存部署日志
        self.save_deployment_log()

        return all_success

    def send_deployment_notification(self, success):
        """发送部署通知"""
        # 实现通知逻辑
        pass

    def save_deployment_log(self):
        """保存部署日志"""
        log_file = f"deployments/deploy_{datetime.now().strftime('%Y%m%d_%H%M%S')}.log"

        with open(log_file, 'w') as f:
            f.write('\n'.join(self.deployment_log))

        self.log_step("日志", f"部署日志已保存到: {log_file}")

# 部署配置文件示例 (deploy_config.yaml)
deploy_config = """
app_name: "my-webapp"
version: "1.2.0"
previous_version: "1.1.0"
project_path: "/path/to/project"
app_port: 8080
test_command: "pytest tests/"

servers:
  - host: "web01.example.com"
    user: "deploy"
    key_path: "/home/deploy/.ssh/id_rsa"
    port: 80
    data_path: "/data/webapp"
    environment: "production"

  - host: "web02.example.com"
    user: "deploy"
    key_path: "/home/deploy/.ssh/id_rsa"
    port: 80
    data_path: "/data/webapp"
    environment: "production"

  - host: "staging.example.com"
    user: "deploy"
    key_path: "/home/deploy/.ssh/id_rsa"
    port: 8080
    data_path: "/data/staging"
    environment: "staging"
"""

if __name__ == "__main__":
    pipeline = DeploymentPipeline("deploy_config.yaml")

    # 设置部署环境
    os.environ['DEPLOY_ENV'] = 'production'

    # 运行部署流水线
    success = pipeline.run_pipeline()

    if success:
        print("🎉 部署成功!")
        sys.exit(0)
    else:
        print("❌ 部署失败!")
        sys.exit(1)
四、Xshell与DevOps工具集成
4.1 Ansible与Xshell集成
4.1.1 Ansible Playbook示例
yaml
# site.yml - 使用Ansible管理服务器
- name: 配置Web服务器集群
  hosts: webservers
  become: yes
  vars:
    nginx_version: 1.18.0
    app_port: 8080

  tasks:
    - name: 安装必要软件包
      apt:
        name: "{{ item }}"
        state: present
        update_cache: yes
      loop:
        - nginx
        - python3-pip
        - git
        - curl

    - name: 配置Nginx
      template:
        src: templates/nginx.conf.j2
        dest: /etc/nginx/sites-available/{{ app_name }}
      notify:
        - 重启Nginx

    - name: 部署应用程序
      git:
        repo: "{{ git_repository }}"
        dest: "/var/www/{{ app_name }}"
        version: "{{ git_branch }}"

    - name: 安装Python依赖
      pip:
        requirements: "/var/www/{{ app_name }}/requirements.txt"

    - name: 配置系统服务
      template:
        src: templates/app.service.j2
        dest: /etc/systemd/system/{{ app_name }}.service
      notify:
        - 重启应用服务

    - name: 启用防火墙规则
      ufw:
        rule: allow
        port: "{{ app_port }}"
        proto: tcp

  handlers:
    - name: 重启Nginx
      service:
        name: nginx
        state: restarted

    - name: 重启应用服务
      systemd:
        name: "{{ app_name }}"
        state: restarted
        daemon_reload: yes
4.1.2 通过Xshell执行Ansible
vbscript
' 通过Xshell执行Ansible的VBScript
Sub RunAnsiblePlaybook
    Dim xsh, session
    Set xsh = CreateObject("Xshell.Application")

    ' 连接到Ansible控制节点
    Set session = xsh.Sessions.Item("ansible-control")

    If Not session.Connected Then
        session.Connect
        WScript.Sleep 2000
    End If

    ' 执行Ansible命令
    session.Send "cd /etc/ansible" & vbCr
    WScript.Sleep 500

    ' 运行Playbook
    session.Send "ansible-playbook site.yml -i production.ini" & vbCr

    ' 等待执行完成并捕获输出
    WScript.Sleep 5000

    ' 可以将输出保存到文件
    session.Send "echo $? > /tmp/ansible_exit_code.txt" & vbCr

    MsgBox "Ansible Playbook执行完成"
End Sub
4.2 Jenkins与Xshell集成
4.2.1 Jenkins Pipeline脚本
groovy
// Jenkinsfile - 集成Xshell的CI/CD流水线
pipeline {
    agent any

    environment {
        DEPLOY_ENV = 'production'
        SSH_KEY = credentials('server-ssh-key')
    }

    stages {
        stage('代码检出') {
            steps {
                git branch: 'main',
                    url: 'git@github.com:company/webapp.git'
            }
        }

        stage('代码检查') {
            steps {
                sh 'pylint **/*.py'
                sh 'bandit -r .'
            }
        }

        stage('单元测试') {
            steps {
                sh 'pytest tests/ --cov=. --cov-report=xml'
            }
            post {
                always {
                    junit 'test-reports/*.xml'
                    cobertura coberturaReportFile: 'coverage.xml'
                }
            }
        }

        stage('构建Docker镜像') {
            steps {
                script {
                    dockerImage = docker.build("webapp:${env.BUILD_ID}")
                }
            }
        }

        stage('部署到服务器') {
            steps {
                script {
                    // 使用Xshell通过SSH部署
                    def servers = ['web01', 'web02', 'web03']

                    servers.each { server ->
                        sh """
                        # 通过SSH执行部署脚本
                        ssh -i ${SSH_KEY} deploy@${server}.example.com << 'EOF'
                        #!/bin/bash
                        set -e

                        # 停止旧容器
                        docker stop webapp || true
                        docker rm webapp || true

                        # 拉取新镜像
                        docker pull registry.example.com/webapp:${env.BUILD_ID}

                        # 运行新容器
                        docker run -d \\
                          --name webapp \\
                          --restart=always \\
                          -p 80:8080 \\
                          -v /data/webapp:/app/data \\
                          registry.example.com/webapp:${env.BUILD_ID}

                        echo "部署完成: ${server}"
                        EOF
                        """
                    }
                }
            }
        }

        stage('健康检查') {
            steps {
                script {
                    // 检查所有服务器是否正常
                    def servers = ['web01', 'web02', 'web03']

                    servers.each { server ->
                        retry(3) {
                            sh """
                            curl -f http://${server}.example.com/health || exit 1
                            """
                        }
                    }
                }
            }
        }
    }

    post {
        success {
            slackSend(
                channel: '#deployments',
                message: "✅ 部署成功: ${env.JOB_NAME} #${env.BUILD_NUMBER}"
            )
        }
        failure {
            slackSend(
                channel: '#deployments',
                message: "❌ 部署失败: ${env.JOB_NAME} #${env.BUILD_NUMBER}"
            )
        }
    }
}
五、高级故障排除与诊断
5.1 自动化诊断脚本
bash
#!/bin/bash
# advanced_diagnostics.sh - 高级服务器诊断工具

DIAG_LOG="/var/log/diagnostics_$(date +%Y%m%d_%H%M%S).log"
EMAIL_RECIPIENTS="admin@example.com"

# 颜色定义
RED='\033[0;31m'
GREEN='\033[0;32m'
YELLOW='\033[1;33m'
NC='\033[0m' # No Color

log() {
    echo -e "$(date '+%Y-%m-%d %H:%M:%S') - $1" | tee -a "$DIAG_LOG"
}

check_status() {
    if [ $? -eq 0 ]; then
        echo -e "${GREEN}✓${NC} $1"
        log "SUCCESS: $1"
    else
        echo -e "${RED}✗${NC} $1"
        log "FAILED: $1"
    fi
}

# 1. 系统概览
log "=== 系统诊断开始 ==="
echo -e "${YELLOW}=== 系统概览 ===${NC}"
hostnamectl | tee -a "$DIAG_LOG"
uptime | tee -a "$DIAG_LOG"

# 2. 硬件资源检查
echo -e "\n${YELLOW}=== 硬件资源检查 ===${NC}"
echo "CPU信息:" | tee -a "$DIAG_LOG"
lscpu | grep -E "Model name|CPU\(s\)" | tee -a "$DIAG_LOG"

echo -e "\n内存使用:" | tee -a "$DIAG_LOG"
free -h | tee -a "$DIAG_LOG"

echo -e "\n磁盘使用:" | tee -a "$DIAG_LOG"
df -h | tee -a "$DIAG_LOG"

# 3. 服务状态检查
echo -e "\n${YELLOW}=== 服务状态检查 ===${NC}"
services=("nginx" "mysql" "docker" "ssh")
for service in "${services[@]}"; do
    systemctl is-active --quiet "$service"
    check_status "$service 服务状态"
done

# 4. 网络检查
echo -e "\n${YELLOW}=== 网络检查 ===${NC}"
echo "网络连接:" | tee -a "$DIAG_LOG"
netstat -tulpn | grep LISTEN | tee -a "$DIAG_LOG"

echo -e "\n防火墙状态:" | tee -a "$DIAG_LOG"
ufw status verbose | tee -a "$DIAG_LOG"

# 5. 安全检查
echo -e "\n${YELLOW}=== 安全检查 ===${NC}"
echo "失败的SSH登录:" | tee -a "$DIAG_LOG"
grep "Failed password" /var/log/auth.log | tail -10 | tee -a "$DIAG_LOG"

echo -e "\n最近登录记录:" | tee -a "$DIAG_LOG"
last -10 | tee -a "$DIAG_LOG"

# 6. 性能分析
echo -e "\n${YELLOW}=== 性能分析 ===${NC}"
echo "CPU使用率最高的进程:" | tee -a "$DIAG_LOG"
ps aux --sort=-%cpu | head -10 | tee -a "$DIAG_LOG"

echo -e "\n内存使用率最高的进程:" | tee -a "$DIAG_LOG"
ps aux --sort=-%mem | head -10 | tee -a "$DIAG_LOG"

# 7. Docker容器状态
echo -e "\n${YELLOW}=== Docker容器状态 ===${NC}"
docker ps --format "table {{.Names}}\t{{.Status}}\t{{.Ports}}" | tee -a "$DIAG_LOG"

# 8. 日志文件检查
echo -e "\n${YELLOW}=== 错误日志检查 ===${NC}"
journalctl --since "1 hour ago" -p err | tail -20 | tee -a "$DIAG_LOG"

# 9. 磁盘性能测试
echo -e "\n${YELLOW}=== 磁盘I/O测试 ===${NC}"
log "开始磁盘I/O测试"
dd if=/dev/zero of=/tmp/testfile bs=1G count=1 oflag=direct 2>&1 | tail -1 | tee -a "$DIAG_LOG"
rm -f /tmp/testfile

# 10. 生成诊断报告摘要
echo -e "\n${YELLOW}=== 诊断报告摘要 ===${NC}"
log "=== 诊断报告摘要 ==="

# 检查关键指标
MEM_USAGE=$(free | grep Mem | awk '{print $3/$2 * 100.0}')
DISK_USAGE=$(df / | awk 'NR==2 {print $5}' | sed 's/%//')
LOAD_AVG=$(uptime | awk -F'load average:' '{print $2}' | awk '{print $1}')

log "内存使用率: ${MEM_USAGE}%"
log "磁盘使用率: ${DISK_USAGE}%"
log "系统负载: ${LOAD_AVG}"

# 发送诊断报告
if [ -n "$EMAIL_RECIPIENTS" ]; then
    mail -s "服务器诊断报告 - $(hostname)" "$EMAIL_RECIPIENTS" < "$DIAG_LOG"
    log "诊断报告已发送到: $EMAIL_RECIPIENTS"
fi

echo -e "\n${GREEN}诊断完成,详细报告已保存到: $DIAG_LOG${NC}"
log "=== 系统诊断结束 ==="
5.2 实时性能监控面板
python
# performance_dashboard.py - 实时性能监控面板
import psutil
import time
from datetime import datetime
import curses
import json
from collections import deque
import threading

class PerformanceDashboard:
    def __init__(self, update_interval=1, history_size=60):
        self.update_interval = update_interval
        self.history_size = history_size
        self.metrics_history = {
            'cpu': deque(maxlen=history_size),
            'memory': deque(maxlen=history_size),
            'disk': deque(maxlen=history_size),
            'network_sent': deque(maxlen=history_size),
            'network_recv': deque(maxlen=history_size)
        }
        self.running = False

    def collect_metrics(self):
        """收集性能指标"""
        cpu_percent = psutil.cpu_percent(interval=None)
        memory = psutil.virtual_memory()
        disk = psutil.disk_usage('/')
        network = psutil.net_io_counters()

        return {
            'timestamp': datetime.now().strftime('%H:%M:%S'),
            'cpu': cpu_percent,
            'memory_percent': memory.percent,
            'memory_used': memory.used / (1024**3),  # GB
            'memory_total': memory.total / (1024**3), # GB
            'disk_percent': disk.percent,
            'disk_used': disk.used / (1024**3),      # GB
            'disk_total': disk.total / (1024**3),    # GB
            'network_sent': network.bytes_sent / (1024**2), # MB
            'network_recv': network.bytes_recv / (1024**2)  # MB
        }

    def update_history(self, metrics):
        """更新历史数据"""
        self.metrics_history['cpu'].append(metrics['cpu'])
        self.metrics_history['memory'].append(metrics['memory_percent'])
        self.metrics_history['disk'].append(metrics['disk_percent'])
        self.metrics_history['network_sent'].append(metrics['network_sent'])
        self.metrics_history['network_recv'].append(metrics['network_recv'])

    def draw_gauge(self, stdscr, y, x, label, value, max_value=100, width=50):
        """绘制进度条"""
        stdscr.addstr(y, x, f"{label}: ")

        # 计算填充长度
        filled = int((value / max_value) * width)

        # 选择颜色
        color = 1  # 默认绿色
        if value > max_value * 0.8:
            color = 2  # 黄色
        if value > max_value * 0.9:
            color = 3  # 红色

        # 绘制进度条
        stdscr.addstr(y, x + len(label) + 2, "[" + "█" * filled + " " * (width - filled) + "]")

        # 显示数值
        stdscr.addstr(y, x + len(label) + 2 + width + 3, f"{value:.1f}%")

        return color

    def draw_chart(self, stdscr, y, x, label, data, height=10, width=50):
        """绘制简单图表"""
        stdscr.addstr(y, x, f"{label}:")

        if not data:
            return

        # 找出最大值
        max_val = max(data)
        if max_val == 0:
            max_val = 1

        # 绘制图表
        for h in range(height):
            line_y = y + height - h
            for w in range(width):
                if w < len(data):
                    # 计算数据点在图表中的高度
                    data_height = (data[w] / max_val) * height
                    if data_height >= h + 1:
                        stdscr.addch(line_y, x + 3 + w, "█")

    def run_dashboard(self, stdscr):
        """运行监控面板"""
        # 初始化curses
        curses.curs_set(0)
        stdscr.nodelay(1)
        stdscr.timeout(1000)

        # 初始化颜色
        curses.start_color()
        curses.init_pair(1, curses.COLOR_GREEN, curses.COLOR_BLACK)
        curses.init_pair(2, curses.COLOR_YELLOW, curses.COLOR_BLACK)
        curses.init_pair(3, curses.COLOR_RED, curses.COLOR_BLACK)

        self.running = True

        while self.running:
            # 清屏
            stdscr.clear()

            # 获取屏幕尺寸
            height, width = stdscr.getmaxyx()

            # 收集指标
            metrics = self.collect_metrics()
            self.update_history(metrics)

            # 显示标题
            title = f"实时性能监控 - {metrics['timestamp']}"
            stdscr.addstr(0, (width - len(title)) // 2, title, curses.A_BOLD)

            # 显示系统信息
            stdscr.addstr(2, 2, "系统信息:")
            stdscr.addstr(3, 4, f"主机名: {psutil.users()[0].name if psutil.users() else 'N/A'}")
            stdscr.addstr(4, 4, f"CPU核心数: {psutil.cpu_count()}")

            # 绘制仪表
            row = 6
            self.draw_gauge(stdscr, row, 2, "CPU使用率", metrics['cpu'])
            self.draw_gauge(stdscr, row + 1, 2, "内存使用率", metrics['memory_percent'])
            self.draw_gauge(stdscr, row + 2, 2, "磁盘使用率", metrics['disk_percent'])

            # 显示详细数值
            stdscr.addstr(row + 4, 2, f"内存: {metrics['memory_used']:.1f}GB / {metrics['memory_total']:.1f}GB")
            stdscr.addstr(row + 5, 2, f"磁盘: {metrics['disk_used']:.1f}GB / {metrics['disk_total']:.1f}GB")

            # 绘制图表
            chart_start = 60
            if width > chart_start + 60:
                self.draw_chart(stdscr, row, chart_start, "CPU历史", list(self.metrics_history['cpu']))
                self.draw_chart(stdscr, row + 5, chart_start, "内存历史", list(self.metrics_history['memory']))

            # 显示进程列表
            process_start = 15
            stdscr.addstr(process_start, 2, "进程列表 (按CPU排序):", curses.A_UNDERLINE)

            processes = []
            for proc in psutil.process_iter(['pid', 'name', 'cpu_percent', 'memory_percent']):
                try:
                    processes.append(proc.info)
                except (psutil.NoSuchProcess, psutil.AccessDenied):
                    pass

            # 按CPU使用率排序
            processes.sort(key=lambda x: x['cpu_percent'], reverse=True)

            # 显示前10个进程
            for i, proc in enumerate(processes[:10]):
                if process_start + i + 1 < height:
                    stdscr.addstr(
                        process_start + i + 1, 2,
                        f"{proc['pid']:6} {proc['name']:20} CPU:{proc['cpu_percent']:5.1f}% MEM:{proc['memory_percent']:5.1f}%"
                    )

            # 显示操作提示
            if height > process_start + 12:
                stdscr.addstr(height - 2, 2, "按 'q' 退出 | 按 's' 保存快照 | 按 'r' 刷新")

            # 刷新屏幕
            stdscr.refresh()

            # 检查按键
            key = stdscr.getch()
            if key == ord('q'):
                self.running = False
            elif key == ord('s'):
                self.save_snapshot(metrics)

            # 等待下一次更新
            time.sleep(self.update_interval)

    def save_snapshot(self, metrics):
        """保存性能快照"""
        snapshot = {
            'timestamp': datetime.now().isoformat(),
            'metrics': metrics,
            'history': {k: list(v) for k, v in self.metrics_history.items()}
        }

        filename = f"snapshot_{datetime.now().strftime('%Y%m%d_%H%M%S')}.json"
        with open(filename, 'w') as f:
            json.dump(snapshot, f, indent=2)

        print(f"\n快照已保存到: {filename}")

    def start(self):
        """启动监控面板"""
        try:
            curses.wrapper(self.run_dashboard)
        except KeyboardInterrupt:
            print("\n监控已停止")

# 启动监控面板
if __name__ == "__main__":
    dashboard = PerformanceDashboard(update_interval=2)
    dashboard.start()
六、最佳实践与优化建议
6.1 Xshell配置优化
6.1.1 性能优化设置
vbscript
' 优化Xshell性能的VBScript
Sub OptimizeXshellSettings
    Dim xsh
    Set xsh = CreateObject("Xshell.Application")

    ' 全局设置优化
    With xsh.GlobalSettings
        ' 终端设置
        .Terminal.ScrollBuffer = 10000  ' 增加滚动缓冲区
        .Terminal.BlinkType = 0         ' 禁用光标闪烁
        .Terminal.UseAntiAlias = True   ' 启用抗锯齿

        ' 连接设置
        .SSH.KeepAlive = 60            ' 保持连接活跃
        .SSH.TryKeyboardInteractive = True

        ' 数据传输优化
        .SSH.PacketSize = 32768        ' 增加数据包大小
        .SSH.Compression = True        ' 启用压缩
    End With

    ' 保存设置
    xsh.GlobalSettings.Save

    MsgBox "Xshell设置优化完成"
End Sub
6.1.2 安全配置模板
xml
<!-- 安全配置模板 security_template.xcs -->
<Xshell>
  <Security>
    <Encryption> AES-256 </Encryption>
    <KeyExchange> ECDH </KeyExchange>
    <MAC> HMAC-SHA2-256 </MAC>
    <HostKey> ED25519 </HostKey>
    <Ciphers>
      <Cipher>chacha20-poly1305@openssh.com</Cipher>
      <Cipher>aes256-gcm@openssh.com</Cipher>
      <Cipher>aes128-gcm@openssh.com</Cipher>
    </Ciphers>
  </Security>

  <Authentication>
    <Method>publickey</Method>
    <Method>keyboard-interactive</Method>
    <PublicKey>ED25519</PublicKey>
  </Authentication>
</Xshell>
6.2 运维工作流程优化
6.2.1 标准化操作流程
graph TD
    A[开始运维任务] --> B{任务类型}
    B -->|日常检查| C[执行健康检查脚本]
    B -->|故障处理| D[运行诊断工具]
    B -->|部署更新| E[执行部署流水线]

    C --> F[生成检查报告]
    D --> G[分析诊断结果]
    E --> H[验证部署结果]

    F --> I{是否异常?}
    D --> J{找到原因?}
    H --> K{部署成功?}

    I -->|是| L[记录问题并告警]
    I -->|否| M[记录正常状态]

    J -->|是| N[实施修复方案]
    J -->|否| O[上报高级支持]

    K -->|是| P[更新版本记录]
    K -->|否| Q[执行回滚操作]

    L --> R[创建工单]
    M --> S[归档报告]
    N --> T[验证修复结果]
    O --> U[等待专家处理]
    P --> V[通知相关人员]
    Q --> W[分析失败原因]

    R --> X[跟踪解决进度]
    S --> Y[结束流程]
    T --> Y
    U --> Y
    V --> Y
    W --> Y
    X --> Y

七、总结
通过本文的深入探讨,我们详细介绍了Xshell在高效运维中的各种高级技巧和自动化脚本案例。从基础的会话管理到复杂的自动化部署流水线,从简单的脚本编写到完整的监控系统实现,Xshell展现了其作为专业运维工具的強大能力。
关键要点回顾:
-
会话管理:合理组织服务器会话,使用模板和分组提高效率
-
安全加固:实施双因素认证、密钥轮换和加密连接
-
自动化脚本:利用VBScript、Python等语言编写运维脚本
-
批量操作:实现服务器集群的并行管理和部署
-
监控告警:构建实时的性能监控和自动告警系统
-
集成工具:与Ansible、Jenkins等DevOps工具无缝集成
-
故障诊断:开发自动化诊断工具和实时监控面板
未来发展趋势:
-
AI驱动的运维:结合机器学习实现智能故障预测
-
云原生集成:更好地支持Kubernetes和容器化环境
-
无代码自动化:通过可视化工具降低自动化门槛
-
边缘计算支持:优化对分布式边缘节点的管理
通过掌握这些高阶技巧和自动化方法,运维工程师可以显著提高工作效率,减少人为错误,实现更稳定、更安全的服务器管理。Xshell作为连接工具,配合合理的自动化策略,将成为现代化运维体系中不可或缺的一环。

这里是“一人公司”的成长家园。我们提供从产品曝光、技术变现到法律财税的全栈内容,并连接云服务、办公空间等稀缺资源,助你专注创造,无忧运营。
更多推荐


 15
15 0
0- 0


 已为社区贡献44条内容

所有评论(0)